Sodium Alginate Concentration vs. Paste Viscosity: How to Build a Working Curve for Your Mill
Sodium alginate concentration and viscosity are not linearly proportional. Each mill should build a controlled...
Sodium alginate concentration and printing-paste viscosity are strongly related, but the relationship is not linear and should not be estimated by simple multiplication. As concentration increases, alginate chains move from relatively separated states toward stronger overlap and entanglement, while shear rate, molecular weight, temperature, salts and water quality change the measured viscosity at the same time. For a textile mill, the useful solution is not a universal concentration chart—it is a plant-specific working curve built with the actual sodium alginate grade, water, mixing method and viscosity test. This guide shows how to build that curve and connect it to screen running, color yield, wash-off and Total Cost in Use.
Why Sodium Alginate Concentration and Viscosity Are Not Linear
A common shortcut is to assume:
If 1% sodium alginate gives viscosity X, then 2% should give approximately 2X.
That assumption is usually unreliable.
Polymer solutions do not behave like simple mixtures where doubling concentration automatically doubles resistance to flow.
As sodium alginate concentration increases, the number of polymer chains per unit volume increases and the chains begin to overlap and interact more strongly.
Published rheology studies show that sodium alginate can move through different concentration regimes with different power-law relationships between concentration and viscosity. In concentrated regimes, a relatively small increase in alginate concentration can produce a much larger increase in viscosity.
This means the working curve is usually curved rather than a straight line.
For textile printing, that matters because a small dosage correction near the upper part of the curve may change paste viscosity far more than the same dosage correction at a lower concentration.
What Changes as Alginate Concentration Increases?
At very low concentration, alginate chains are relatively separated.
As concentration increases, the chains begin to overlap.
At still higher concentration, entanglement and intermolecular interaction become much more important.
These transitions are why the concentration-viscosity relationship can become steep.
One published sodium alginate study identified different concentration regimes and reported much stronger viscosity dependence after chain overlap and entanglement became important.
Another study using 0.5–2.0% alginate showed viscosity increasing from approximately 0.04 Pa·s at 0.5% to approximately 0.93 Pa·s at 2.0% under that study’s specific test conditions—a change far larger than a simple fourfold concentration ratio would suggest.
These values are research examples, not textile specifications.
The mill should build its own curve with the actual commercial grade.
Why Shear Rate Changes the Curve
Sodium alginate solutions often show pseudoplastic or shear-thinning behavior, especially at concentrations relevant to higher-body printing pastes.
That means the apparent viscosity decreases as shear rate increases.
In practice:
At rest, the paste may appear thick.
During pumping, it becomes easier to move.
Under the squeegee or rotary screen, apparent viscosity can fall further.
After deposition, some structure recovers.
Therefore, two concentration-viscosity curves measured at different spindle speeds or shear rates are not directly comparable.
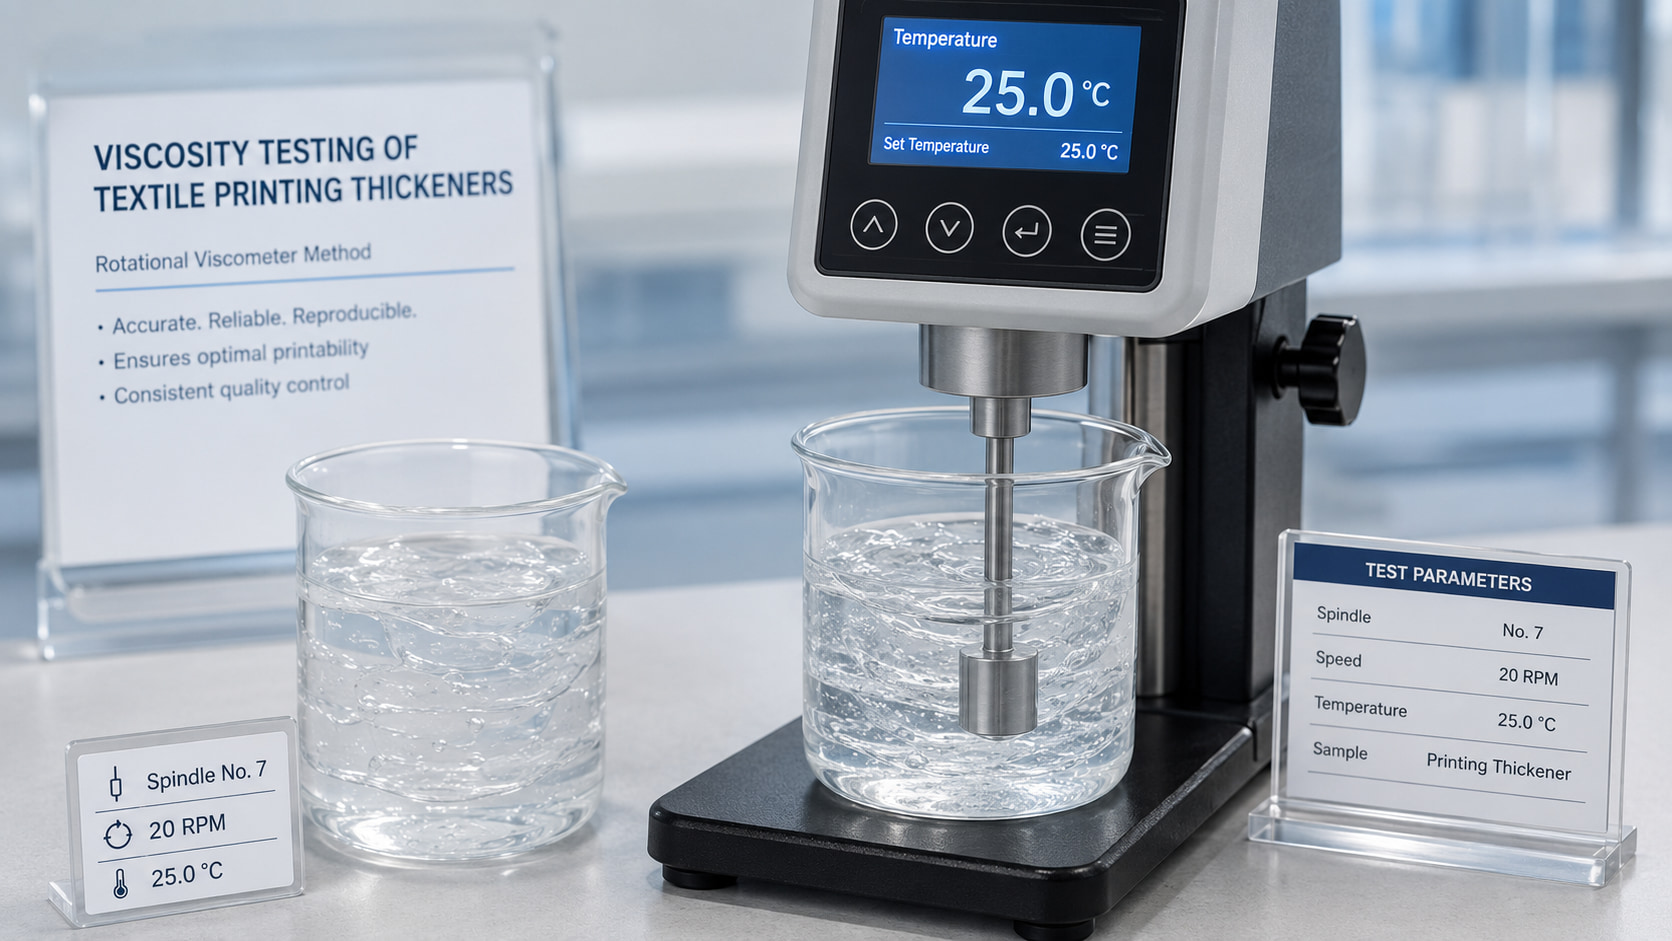
A useful working curve must specify:
Instrument
Spindle or rotor
RPM or shear rate
درجة الحرارة
الوقت اللازم للقراءة
Concentration without test method is not a complete viscosity specification.
Why Different Alginate Grades Need Different Curves
Two sodium alginate grades can have different:
Molecular weight
Molecular-weight distribution
M/G composition
Chain structure
Purity
حجم الجسيمات
These differences change the amount of product required to build a given viscosity.
A high-viscosity grade may reach the target paste body at a lower concentration.
A medium- or low-viscosity grade may require a higher concentration but can deliver different flow and screen behavior.
This means:
Same concentration does not mean same viscosity.
And:
Same viscosity does not necessarily mean same rheology or printing performance.
FSX Chemical’s current sodium alginate range uses different reference concentrations for high-, medium- and low-viscosity grades, illustrating why grade comparison must keep concentration and measurement method visible.
Temperature Must Be Fixed Before You Build the Curve
Sodium alginate viscosity is temperature-sensitive.
In general, a warmer solution shows lower apparent viscosity than the same solution measured at a cooler temperature.
Published rheological studies of commercial alginates have shown strong effects of both concentration and temperature on consistency and apparent viscosity.
For mill QC, every concentration point should therefore be conditioned to the same test temperature before measurement.
Do not compare:
3% sample at 23°C
مع:
4% sample at 31°C
and treat the difference as concentration alone.
Water Quality Can Shift the Entire Working Curve
Water is part of the formulation.
Hardness, calcium, magnesium, conductivity and other dissolved salts can change sodium alginate rheology.
Calcium is particularly important because it can associate strongly with alginate and create local thickening, gel particles or less-soluble calcium alginate.
If the curve is built in deionized water but production uses hard plant water, the curve may not predict factory behavior.
A practical approach is to build:
A reference-water curve for material comparison.
A plant-water curve for production control.
If the two curves are significantly different, investigate water treatment and calcium before adjusting alginate dosage.
Stock-Paste Curve vs. Complete Reactive-Paste Curve
The sodium alginate stock paste is only the first curve.
The complete reactive color paste can also contain:
Reactive dye
Alkali
Urea where used
Anti-reducing salt
Other process auxiliaries
These components can change ionic strength, pH and apparent viscosity.
Therefore, a mill should distinguish:
Curve A: Sodium Alginate + Water
Useful for:
Incoming QC
Grade comparison
Basic concentration selection
Curve B: Complete Reactive Printing Paste
Useful for:
Production dosage
عرض الشاشة
استقرار الحيازة
معدل إنتاج الألوان
قابل للغسل
The second curve is usually more important for production approval.
What Should a Mill Use the Working Curve For?
A concentration-viscosity working curve can support several decisions.
اختيار الدرجة
Determine whether a high-, medium- or lower-viscosity alginate reaches the required printing window at a practical concentration.
Dosage Optimization
Avoid adding more alginate after the curve has already entered a steep region where small dosage changes create excessive viscosity.
Batch Adjustment
If an incoming batch is slightly different but inside specification, the curve helps predict whether a small dosage correction is reasonable.
Production Troubleshooting
If viscosity changes without concentration changing, investigate water, temperature, salt, alkali or hydration rather than adding more powder immediately.
Cost Comparison
Compare the cost to reach an approved printing window—not price per kilogram alone.
Step 1: Define One Standard Test Method
Before preparing any concentration series, write one test SOP.
It should define:
مصدر المياه
Alginate concentration basis: w/w or w/v
Total sample size
معدل إضافة المسحوق
Mixer type
Mixing speed
مدة الخلط
وقت الترطيب
Rest/defoaming time
درجة حرارة القياس
مقياس اللزوجة
Spindle or rotor
RPM or shear rate
الوقت اللازم للقراءة
Without this SOP, the curve may reflect preparation differences instead of concentration.
Step 2: Choose the Concentration Ladder
Do not start with only two concentrations.
Two points can make a strongly curved relationship look linear.
A practical mill study normally uses at least five points around the expected production region.
For example, if the current dosage is treated as 100%, build relative points such as:
Relative Point
الغرض
70–80% of current concentration
Lower-viscosity reference
90% of current concentration
Below-target sensitivity
100% of current concentration
Current production baseline
110%
Above-target sensitivity
120–130%
Shows whether curve becomes steep
These are study-design examples, not recommended production dosages.
If the target grade is completely new, first run a broad screening curve and then build a narrower curve around the useful region.
Step 3: Standardize Hydration
Incomplete hydration can create a false concentration curve.
A higher-concentration sample often needs more careful preparation because:
Powder wets more slowly.
Lumps form more easily.
Mixing torque increases.
Air can be incorporated.
Hydration can continue after the first reading.
Use the same preparation principle for every point.
Where practical, verify that viscosity has reached a stable plateau before recording the final value.
Also inspect:
Fish-eyes
جزيئات الهلام
الرغوة
بقايا الترشيح
A 5% sample that is only 80% hydrated cannot be fairly compared with a fully hydrated 3% sample.
Step 4: Measure Viscosity Correctly
Condition every sample to the same temperature.
Then record:
التركيز
اللزوجة
Instrument
Spindle/rotor
عدد الدورات في الدقيقة
درجة الحرارة
Time after preparation
If the selected spindle or speed is outside the instrument’s suitable torque range at one concentration, do not silently change the method and combine the numbers into one curve.
Either:
Choose a method that can measure the entire intended range, or
Create clearly separated curves with clearly stated methods.
This is particularly important when moving from low-viscosity to high-viscosity grades.
Step 5: Plot the Concentration-Viscosity Curve
Plot concentration on the x-axis and measured viscosity on the y-axis.
Do not force the data into a straight line if the points are clearly curved.
For normal production use, the most useful output is often a simple graph with:
Measured data points
A smooth fitted trend
The approved production-viscosity band
The current production concentration
A more technical laboratory can also use a log-log plot to identify changes in concentration regime.
The objective is not to create the most sophisticated mathematical model.
The objective is to answer:
How much does viscosity change when this mill changes this alginate concentration by a small practical amount?
Step 6: Add Complete Reactive-Paste Testing
Once the useful stock-paste region is identified, repeat the relevant points in the complete printing formula.
Keep constant:
Reactive dye
Dye loading
Alkali
Urea/auxiliaries
الماء
Mixing order
مدة الانتظار
درجة الحرارة
القياس:
Immediate viscosity
Viscosity after the planned holding time
الرقم الهيدروجيني
المظهر
Gel or residue
If alkali is added late in the mill’s process, build the curve using the same timing.
Same concentration behaves differently between batches
Viscosity QC, water, hydration, temperature
Dosage alone controls performance
What Information Should You Send to a Sodium Alginate Supplier?
If you want to build or optimize a concentration-viscosity working curve, send:
Current sodium alginate TDS/sample
Current stock-paste concentration
Current printing dosage
Target viscosity
Complete viscosity test method
Water source and hardness where relevant
Mixing and hydration method
Reactive dye class and loading
Complete or simplified printing formula
Alkali type and timing
غربال مسطح أو دوار
نوع القماش وطريقة صنعه
Steaming and washing conditions
Main target: sharpness, screen running, K/S, wash-off or cost
يمكن لشركة FSX Chemical الاستفادة من هذه المعلومات من خلال العينات والمطابقة to build a controlled concentration comparison for a relevant sodium alginate grade.
How Should a Mill Build Its Sodium Alginate Working Curve?
Concentration and viscosity are not linearly proportional.
Higher concentration increases chain overlap and can move the paste into a much steeper viscosity regime.
Shear rate, temperature and water quality must remain controlled.
Each sodium alginate grade needs its own concentration-viscosity curve.
The pure-water curve is a QC tool; the complete reactive-paste curve is the production tool.
The best concentration is the one that delivers a stable printing window and finished-fabric result at the lowest Total Cost in Use.
الأسئلة الشائعة
1. Is sodium alginate viscosity proportional to concentration?
No. The relationship is generally nonlinear because polymer-chain overlap and entanglement become much stronger as concentration increases.
2. If 1% sodium alginate has 1,000 mPa·s, will 2% have 2,000 mPa·s?
Not reliably. Depending on the grade and test conditions, 2% can be much more than twice the 1% viscosity. Build a measured curve instead of extrapolating.
3. How many concentration points should I test?
At least five points around the expected production region are useful for seeing whether the relationship is curved or becoming steep.
4. Should I use w/w or w/v concentration?
Either can be used if clearly defined and used consistently. Do not compare results from different concentration bases as if they were identical.
5. Why does sodium alginate become much thicker at higher concentration?
Polymer chains increasingly overlap, entangle and interact, so viscosity can rise much faster than concentration itself.
6. Does higher concentration always improve print sharpness?
No. More paste body can reduce spreading, but excessive concentration can hurt screen passage, transfer, leveling and solid-area uniformity.
7. Can higher sodium alginate concentration reduce color yield?
It can in some formulations if excessive paste structure changes dye transfer, penetration or fixation. Compare final K/S after identical steaming and washing.
8. Should high-, medium- and low-viscosity alginates be compared at the same concentration?
Not as the only comparison. First identify the concentration each grade needs to reach the useful printing-rheology window, then compare performance and cost.
9. Why is my factory viscosity curve different from the supplier’s?
Water quality, temperature, hydration, concentration basis, instrument, spindle and RPM can all shift the measured curve.
10. Should I build the curve with DI water or plant water?
Ideally both: reference water for material comparison and plant water for production prediction.
11. Is the stock-paste curve enough for production approval?
No. Build or verify the relevant points again in the complete reactive paste and confirm them through printing, steaming and washing.
12. What should I send FSX Chemical for concentration-curve matching?
Send the current alginate TDS/sample, concentration, viscosity method, water data, reactive formula, screen route, fabric, fixation and main performance target.
Build a Sodium Alginate Working Curve for Your Mill
If your mill is comparing high-, medium- or low-viscosity sodium alginate, FSX Chemical can help structure a concentration curve that connects laboratory viscosity with actual printing performance.
For a useful comparison, send:
Your current sodium alginate sample, TDS or COA
Current stock-paste concentration
Current printing dosage
Target viscosity range
Complete viscosity test method
Plant-water information
Mixing and hydration procedure
Reactive dye class and formula
Alkali type and addition timing
Screen-printing route
تركيب النسيج
Steaming and washing process
Current sharpness, screen-running, K/S, wash-off or cost target
ابدأ بـ العينات والمطابقة to establish a controlled concentration series.
A sodium alginate working curve should not answer only “How thick is this solution?” It should answer “At what concentration does this specific grade enter the mill’s stable printing window, and what does that concentration cost after printing, steaming and washing are included?”
تعرف على السبب الذي يجعل من المستحيل مقارنة قيم لزوجة مكثفات الطباعة النسيجية دون مطابقة كل من التركيز، ودرجة الحرارة، والجهاز المستخدم، والمغزل، والسرعة، وطريقة التحضير، ووقت الاختبار.
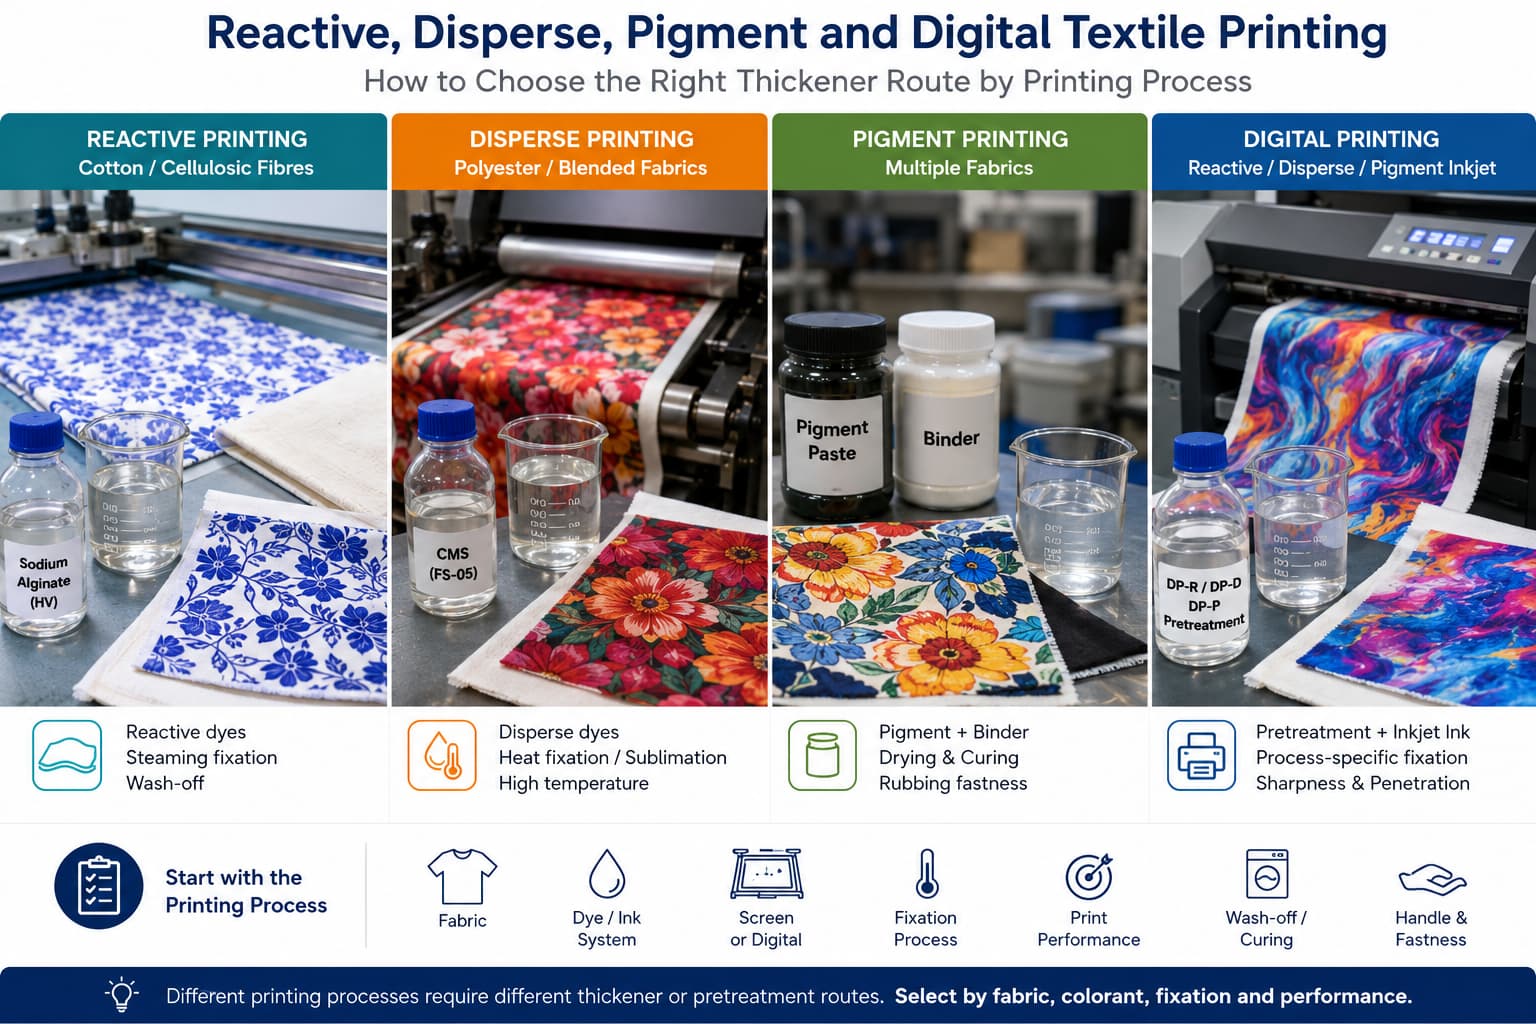
تعرف على كيفية اختيار المُكثِّف وطرق المعالجة المسبقة للطباعة النسيجية التفاعلية، والطباعة بالتشتت، والطباعة بالصبغات، والطباعة الرقمية، بناءً على متطلبات النسيج، والصبغة أو الحبر، والتثبيت، وقابلية الغسل، وجودة الطباعة.
قارن بين CMC وCMS وألجينات الصوديوم ومعجون الطباعة الرقمية المستخدمة في طباعة المنسوجات. تعرف على مدى ملاءمة كل خيار لعمليات الطباعة التفاعلية، والطباعة بالتشتت، والطباعة بالصبغات، والطباعة الرقمية، وما يجب على المشترين مراجعته قبل اختبار العينات، ومطابقة الدرجات، والشراء بالجملة.
يُستخدم ألجينات الصوديوم على نطاق واسع في طباعة المنسوجات كمكثف مستقر وقابل للغسل لمعجون الطباعة التفاعلي. تعرف على كيفية تقييم درجة اللزوجة والنقاء ومدى ملاءمة الاستخدام قبل الشراء، وكيف تدعم شركة FSX Chemical المشترين العالميين من خلال توفير البيانات الفنية والعينات.
يُستخدم كل من ألجينات الصوديوم وCMC كمكثفات في طباعة المنسوجات، لكنهما يناسبان أنظمة صبغ وظروف معالجة مختلفة. يشرح هذا الدليل الاختلافات الرئيسية بينهما ومتى يتم استخدام كل منهما.
تختلف متطلبات المعجون والمعالجة المسبقة في الطباعة الرقمية بنفث الحبر على المنسوجات عن تلك الخاصة بالطباعة بالشاشة الحريرية. يشرح هذا الدليل كيفية استخدام ألجينات الصوديوم في الطباعة الرقمية على المنسوجات، والمعايير التي يجب على فرق المشتريات تحديدها فيما يتعلق بدرجات الجودة.
يُعد التحضير الصحيح للمادة اللزجة أمرًا لا يقل أهمية عن اختيار الدرجة في طباعة المنسوجات بالأصباغ التفاعلية. يتناول هذا الدليل طرق إذابة ألجينات الصوديوم، ونطاقات التركيز حسب الاستخدام، وظروف التخزين، وكيفية معالجة المشكلات الشائعة في عملية التحضير.
Assess sodium alginate in reactive-printing wastewater using measured COD load, product-specific biodegradation evidence and controlled process comparisons. Includes a buyer checklist and illustrative load calculation.
يؤثر معدل تثبيت الصبغة بشكل مباشر على إنتاجية اللون، وثبات الألوان عند الغسيل، وحجم مياه الصرف في الطباعة بالصبغات التفاعلية. يشرح هذا الدليل كيف يدعم ألجينات الصوديوم عملية تثبيت الصبغة، وما هي معلمات معجون الصبغة التي تؤثر على معدل التثبيت، وكيفية معالجة مشكلة انخفاض معدل التثبيت أثناء الإنتاج.
يؤثر حجم جزيئات ألجينات الصوديوم (المش) على سرعة ذوبان المسحوق، ومدى توزيعه المتساوي عند الترطيب، وأداء المعجون الناتج في الطباعة بالشاشة الحريرية. يشرح هذا الدليل الآثار العملية لمواصفات المش في تطبيقات معجون طباعة المنسوجات.
Evaluate sodium alginate for warp sizing through grade-specific bath, yarn and desizing trials. Compare dry size add-on, yarn protection and removal using appropriate residue methods and downstream fabric checks.
لا تقتصر مواصفات نقاء ألجينات الصوديوم على رقم واحد فقط. يشرح هذا الدليل ما تعنيه بيانات المحتوى الفعال، وكلوريد الصوديوم (NaCl)، والمواد غير القابلة للذوبان، والمعادن الثقيلة بالنسبة لأداء معجون طباعة المنسوجات — ومتى يكون من المفيد تحديد درجة نقاء أعلى بدلاً من الدرجة الصناعية القياسية.
يرجى إرسال اسم المنتج، والتطبيق، والكمية، والوجهة، وأي بيانات تقنية (TDS)،
أو صورة عينة أو مستند متوفر لديكم بالفعل. وستقوم شركة FSX Chemical بمراجعة
هذه المعلومات وتقديم توصية بشأن الخطوة التالية سواء كانت تقديم عرض أسعار، أو مطابقة العينة،
أو اختيار المنتج.
معلومات عن المنتجاسم المنتج، الدرجة، الطراز، صورة الملصق أو مرجع المورد.
الوثائق المتاحةTDS، SDS، COA، صورة العينة، قائمة المنتجات أو بيانات الاختبار.
تفاصيل الطلبالكمية التقديرية، والتعبئة، وبلد المقصد، والميناء، أو الشروط التجارية.
الطلب أو المشكلةعملية طباعة المنسوجات، متطلبات التركيبة، المشكلات الحالية أو الأداء المستهدف.