Sodium Alginate Concentration vs. Paste Viscosity: How to Build a Working Curve for Your Mill
Sodium alginate concentration and viscosity are not linearly proportional. Each mill should build a controlled...
Sodium alginate concentration and printing-paste viscosity are strongly related, but the relationship is not linear and should not be estimated by simple multiplication. As concentration increases, alginate chains move from relatively separated states toward stronger overlap and entanglement, while shear rate, molecular weight, temperature, salts and water quality change the measured viscosity at the same time. For a textile mill, the useful solution is not a universal concentration chart—it is a plant-specific working curve built with the actual sodium alginate grade, water, mixing method and viscosity test. This guide shows how to build that curve and connect it to screen running, color yield, wash-off and Total Cost in Use.
Why Sodium Alginate Concentration and Viscosity Are Not Linear
A common shortcut is to assume:
If 1% sodium alginate gives viscosity X, then 2% should give approximately 2X.
That assumption is usually unreliable.
Polymer solutions do not behave like simple mixtures where doubling concentration automatically doubles resistance to flow.
As sodium alginate concentration increases, the number of polymer chains per unit volume increases and the chains begin to overlap and interact more strongly.
Published rheology studies show that sodium alginate can move through different concentration regimes with different power-law relationships between concentration and viscosity. In concentrated regimes, a relatively small increase in alginate concentration can produce a much larger increase in viscosity.
This means the working curve is usually curved rather than a straight line.
For textile printing, that matters because a small dosage correction near the upper part of the curve may change paste viscosity far more than the same dosage correction at a lower concentration.
What Changes as Alginate Concentration Increases?
At very low concentration, alginate chains are relatively separated.
As concentration increases, the chains begin to overlap.
At still higher concentration, entanglement and intermolecular interaction become much more important.
These transitions are why the concentration-viscosity relationship can become steep.
One published sodium alginate study identified different concentration regimes and reported much stronger viscosity dependence after chain overlap and entanglement became important.
Another study using 0.5–2.0% alginate showed viscosity increasing from approximately 0.04 Pa·s at 0.5% to approximately 0.93 Pa·s at 2.0% under that study’s specific test conditions—a change far larger than a simple fourfold concentration ratio would suggest.
These values are research examples, not textile specifications.
The mill should build its own curve with the actual commercial grade.
Why Shear Rate Changes the Curve
Sodium alginate solutions often show pseudoplastic or shear-thinning behavior, especially at concentrations relevant to higher-body printing pastes.
That means the apparent viscosity decreases as shear rate increases.
In practice:
At rest, the paste may appear thick.
During pumping, it becomes easier to move.
Under the squeegee or rotary screen, apparent viscosity can fall further.
After deposition, some structure recovers.
Therefore, two concentration-viscosity curves measured at different spindle speeds or shear rates are not directly comparable.
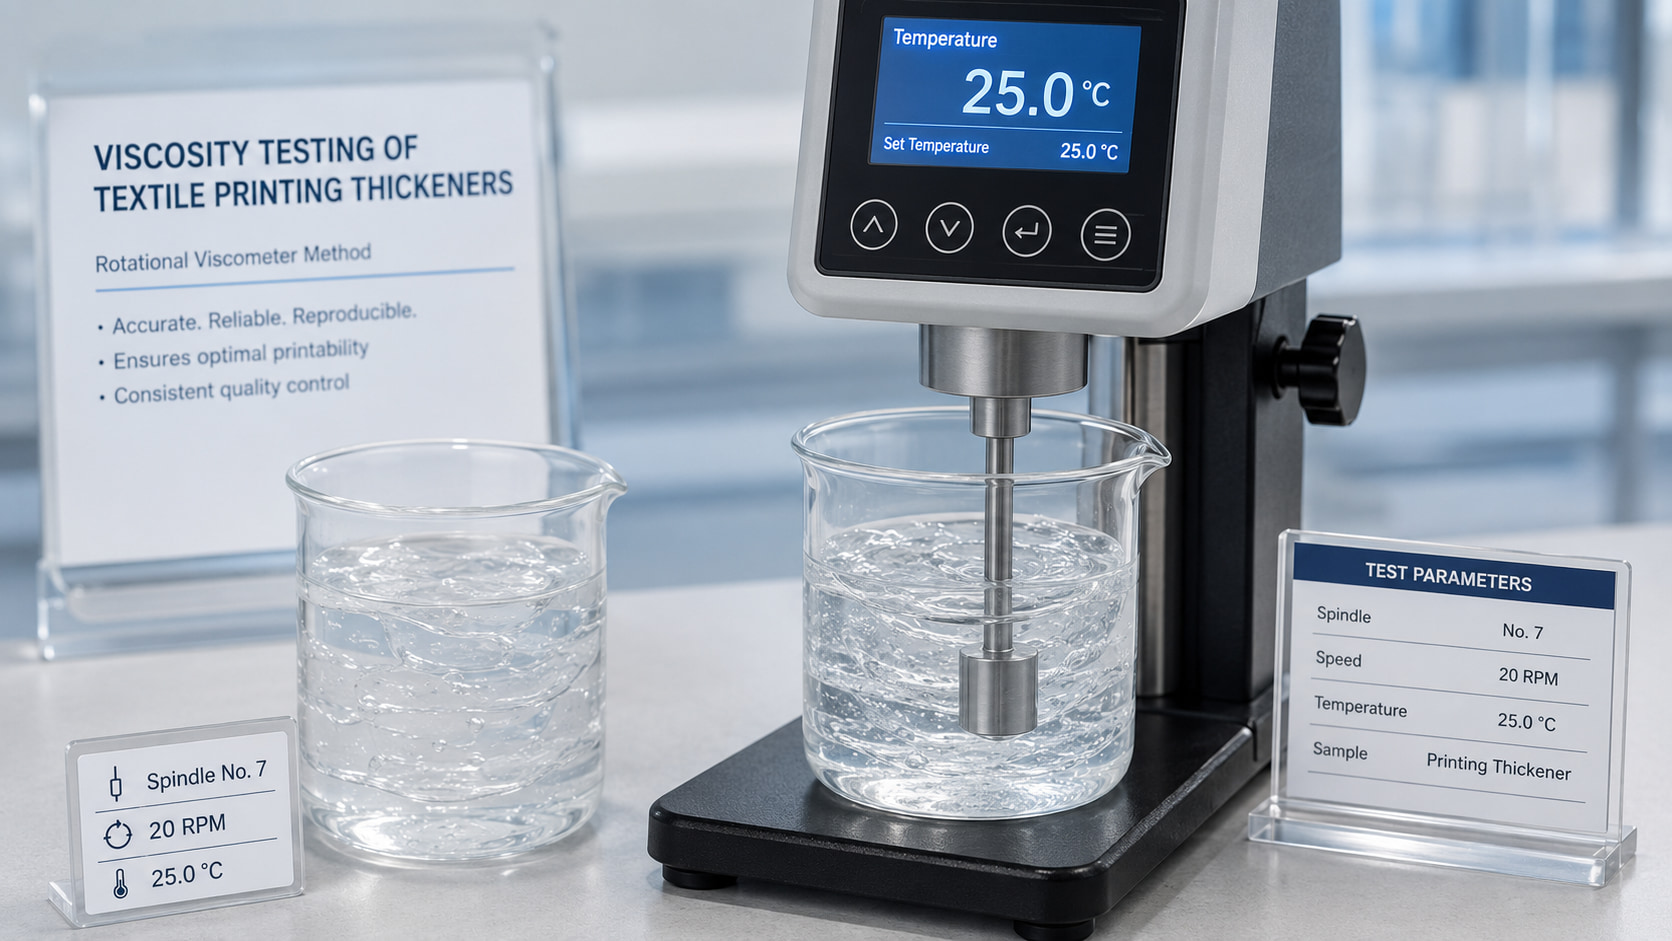
A useful working curve must specify:
Instrument
Spindle or rotor
RPM or shear rate
Temperature
Reading time
Concentration without test method is not a complete viscosity specification.
Why Different Alginate Grades Need Different Curves
Two sodium alginate grades can have different:
Molecular weight
Molecular-weight distribution
M/G composition
Chain structure
Purity
Particle size
These differences change the amount of product required to build a given viscosity.
A high-viscosity grade may reach the target paste body at a lower concentration.
A medium- or low-viscosity grade may require a higher concentration but can deliver different flow and screen behavior.
This means:
Same concentration does not mean same viscosity.
And:
Same viscosity does not necessarily mean same rheology or printing performance.
FSX Chemical’s current sodium alginate range uses different reference concentrations for high-, medium- and low-viscosity grades, illustrating why grade comparison must keep concentration and measurement method visible.
Temperature Must Be Fixed Before You Build the Curve
Sodium alginate viscosity is temperature-sensitive.
In general, a warmer solution shows lower apparent viscosity than the same solution measured at a cooler temperature.
Published rheological studies of commercial alginates have shown strong effects of both concentration and temperature on consistency and apparent viscosity.
For mill QC, every concentration point should therefore be conditioned to the same test temperature before measurement.
Do not compare:
3% sample at 23°C
with:
4% sample at 31°C
and treat the difference as concentration alone.
Water Quality Can Shift the Entire Working Curve
Water is part of the formulation.
Hardness, calcium, magnesium, conductivity and other dissolved salts can change sodium alginate rheology.
Calcium is particularly important because it can associate strongly with alginate and create local thickening, gel particles or less-soluble calcium alginate.
If the curve is built in deionized water but production uses hard plant water, the curve may not predict factory behavior.
A practical approach is to build:
A reference-water curve for material comparison.
A plant-water curve for production control.
If the two curves are significantly different, investigate water treatment and calcium before adjusting alginate dosage.
Stock-Paste Curve vs. Complete Reactive-Paste Curve
The sodium alginate stock paste is only the first curve.
The complete reactive color paste can also contain:
Reactive dye
Alkali
Urea where used
Anti-reducing salt
Other process auxiliaries
These components can change ionic strength, pH and apparent viscosity.
Therefore, a mill should distinguish:
Curve A: Sodium Alginate + Water
Useful for:
Incoming QC
Grade comparison
Basic concentration selection
Curve B: Complete Reactive Printing Paste
Useful for:
Production dosage
Screen running
Holding stability
Color yield
Wash-off
The second curve is usually more important for production approval.
What Should a Mill Use the Working Curve For?
A concentration-viscosity working curve can support several decisions.
Grade Selection
Determine whether a high-, medium- or lower-viscosity alginate reaches the required printing window at a practical concentration.
Dosage Optimization
Avoid adding more alginate after the curve has already entered a steep region where small dosage changes create excessive viscosity.
Batch Adjustment
If an incoming batch is slightly different but inside specification, the curve helps predict whether a small dosage correction is reasonable.
Production Troubleshooting
If viscosity changes without concentration changing, investigate water, temperature, salt, alkali or hydration rather than adding more powder immediately.
Cost Comparison
Compare the cost to reach an approved printing window—not price per kilogram alone.
Step 1: Define One Standard Test Method
Before preparing any concentration series, write one test SOP.
It should define:
Water source
Alginate concentration basis: w/w or w/v
Total sample size
Powder addition rate
Mixer type
Mixing speed
Mixing time
Hydration time
Rest/defoaming time
Measurement temperature
Viscometer
Spindle or rotor
RPM or shear rate
Reading time
Without this SOP, the curve may reflect preparation differences instead of concentration.
Step 2: Choose the Concentration Ladder
Do not start with only two concentrations.
Two points can make a strongly curved relationship look linear.
A practical mill study normally uses at least five points around the expected production region.
For example, if the current dosage is treated as 100%, build relative points such as:
Relative Point
Purpose
70–80% of current concentration
Lower-viscosity reference
90% of current concentration
Below-target sensitivity
100% of current concentration
Current production baseline
110%
Above-target sensitivity
120–130%
Shows whether curve becomes steep
These are study-design examples, not recommended production dosages.
If the target grade is completely new, first run a broad screening curve and then build a narrower curve around the useful region.
Step 3: Standardize Hydration
Incomplete hydration can create a false concentration curve.
A higher-concentration sample often needs more careful preparation because:
Powder wets more slowly.
Lumps form more easily.
Mixing torque increases.
Air can be incorporated.
Hydration can continue after the first reading.
Use the same preparation principle for every point.
Where practical, verify that viscosity has reached a stable plateau before recording the final value.
Also inspect:
Fish-eyes
Gel particles
Foam
Filtration residue
A 5% sample that is only 80% hydrated cannot be fairly compared with a fully hydrated 3% sample.
Step 4: Measure Viscosity Correctly
Condition every sample to the same temperature.
Then record:
Concentration
Viscosity
Instrument
Spindle/rotor
RPM
Temperature
Time after preparation
If the selected spindle or speed is outside the instrument’s suitable torque range at one concentration, do not silently change the method and combine the numbers into one curve.
Either:
Choose a method that can measure the entire intended range, or
Create clearly separated curves with clearly stated methods.
This is particularly important when moving from low-viscosity to high-viscosity grades.
Step 5: Plot the Concentration-Viscosity Curve
Plot concentration on the x-axis and measured viscosity on the y-axis.
Do not force the data into a straight line if the points are clearly curved.
For normal production use, the most useful output is often a simple graph with:
Measured data points
A smooth fitted trend
The approved production-viscosity band
The current production concentration
A more technical laboratory can also use a log-log plot to identify changes in concentration regime.
The objective is not to create the most sophisticated mathematical model.
The objective is to answer:
How much does viscosity change when this mill changes this alginate concentration by a small practical amount?
Step 6: Add Complete Reactive-Paste Testing
Once the useful stock-paste region is identified, repeat the relevant points in the complete printing formula.
Keep constant:
Reactive dye
Dye loading
Alkali
Urea/auxiliaries
Water
Mixing order
Holding time
Temperature
Measure:
Immediate viscosity
Viscosity after the planned holding time
pH
Appearance
Gel or residue
If alkali is added late in the mill’s process, build the curve using the same timing.
Concentration and viscosity are not linearly proportional.
Higher concentration increases chain overlap and can move the paste into a much steeper viscosity regime.
Shear rate, temperature and water quality must remain controlled.
Each sodium alginate grade needs its own concentration-viscosity curve.
The pure-water curve is a QC tool; the complete reactive-paste curve is the production tool.
The best concentration is the one that delivers a stable printing window and finished-fabric result at the lowest Total Cost in Use.
Frequently Asked Questions
1. Is sodium alginate viscosity proportional to concentration?
No. The relationship is generally nonlinear because polymer-chain overlap and entanglement become much stronger as concentration increases.
2. If 1% sodium alginate has 1,000 mPa·s, will 2% have 2,000 mPa·s?
Not reliably. Depending on the grade and test conditions, 2% can be much more than twice the 1% viscosity. Build a measured curve instead of extrapolating.
3. How many concentration points should I test?
At least five points around the expected production region are useful for seeing whether the relationship is curved or becoming steep.
4. Should I use w/w or w/v concentration?
Either can be used if clearly defined and used consistently. Do not compare results from different concentration bases as if they were identical.
5. Why does sodium alginate become much thicker at higher concentration?
Polymer chains increasingly overlap, entangle and interact, so viscosity can rise much faster than concentration itself.
6. Does higher concentration always improve print sharpness?
No. More paste body can reduce spreading, but excessive concentration can hurt screen passage, transfer, leveling and solid-area uniformity.
7. Can higher sodium alginate concentration reduce color yield?
It can in some formulations if excessive paste structure changes dye transfer, penetration or fixation. Compare final K/S after identical steaming and washing.
8. Should high-, medium- and low-viscosity alginates be compared at the same concentration?
Not as the only comparison. First identify the concentration each grade needs to reach the useful printing-rheology window, then compare performance and cost.
9. Why is my factory viscosity curve different from the supplier’s?
Water quality, temperature, hydration, concentration basis, instrument, spindle and RPM can all shift the measured curve.
10. Should I build the curve with DI water or plant water?
Ideally both: reference water for material comparison and plant water for production prediction.
11. Is the stock-paste curve enough for production approval?
No. Build or verify the relevant points again in the complete reactive paste and confirm them through printing, steaming and washing.
12. What should I send FSX Chemical for concentration-curve matching?
Send the current alginate TDS/sample, concentration, viscosity method, water data, reactive formula, screen route, fabric, fixation and main performance target.
Build a Sodium Alginate Working Curve for Your Mill
If your mill is comparing high-, medium- or low-viscosity sodium alginate, FSX Chemical can help structure a concentration curve that connects laboratory viscosity with actual printing performance.
For a useful comparison, send:
Your current sodium alginate sample, TDS or COA
Current stock-paste concentration
Current printing dosage
Target viscosity range
Complete viscosity test method
Plant-water information
Mixing and hydration procedure
Reactive dye class and formula
Alkali type and addition timing
Screen-printing route
Fabric construction
Steaming and washing process
Current sharpness, screen-running, K/S, wash-off or cost target
Start with Samples & Matching to establish a controlled concentration series.
A sodium alginate working curve should not answer only “How thick is this solution?” It should answer “At what concentration does this specific grade enter the mill’s stable printing window, and what does that concentration cost after printing, steaming and washing are included?”
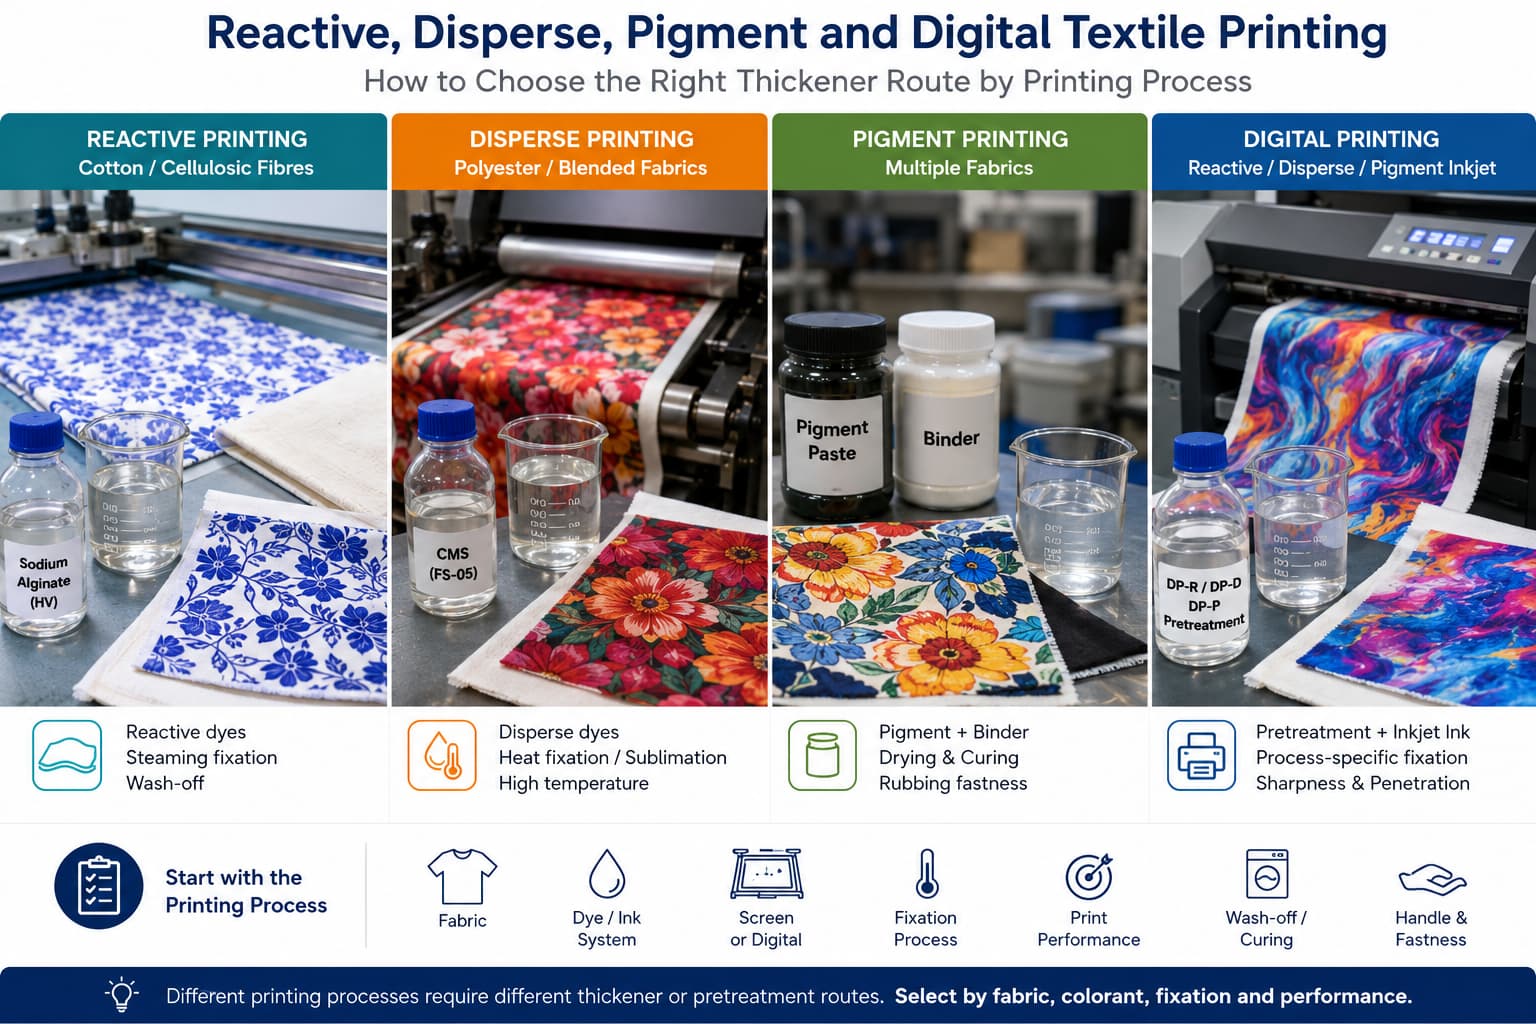
Learn how to choose thickener and pretreatment routes for reactive, disperse, pigment and digital textile printing based on fabric, dye or ink, fixation, wash-off and print-quality requirements.
Compare CMC, CMS, sodium alginate and digital printing paste for textile printing. Learn how each route fits reactive, disperse, pigment and digital processes, and what buyers should review before sample testing, grade matching and bulk purchase.
Sodium alginate is widely used in textile printing as a stable and washable thickener for reactive printing paste. Learn how to evaluate viscosity grade, purity, and application suitability before purchasing, and how FSX Chemical supports global buyers with technical data and samples.
Both sodium alginate and CMC are used as thickeners in textile printing, but they suit different dye systems and process conditions. This guide explains the key differences and when to use each.
Digital inkjet printing on textiles has different paste and pre-treatment requirements compared to screen printing. This guide explains how sodium alginate is used in digital textile printing and what grade parameters procurement teams should specify.
Correct paste preparation is as important as grade selection in reactive dye textile printing. This guide covers sodium alginate dissolution methods, concentration ranges by application, storage conditions, and how to troubleshoot common preparation problems.
Assess sodium alginate in reactive-printing wastewater using measured COD load, product-specific biodegradation evidence and controlled process comparisons. Includes a buyer checklist and illustrative load calculation.
Dye fixation rate directly affects color yield, wash fastness, and wastewater load in reactive dye printing. This guide explains how sodium alginate supports dye fixation, what paste parameters influence fixation rate, and how to troubleshoot low fixation in production.
Sodium alginate particle size (mesh) affects how quickly the powder dissolves, how evenly it hydrates, and how the resulting paste performs in screen printing. This guide explains the practical implications of mesh specification for textile printing paste applications.
Evaluate sodium alginate for warp sizing through grade-specific bath, yarn and desizing trials. Compare dry size add-on, yarn protection and removal using appropriate residue methods and downstream fabric checks.
Sodium alginate purity specifications cover more than a single number. This guide explains what active content, NaCl, insoluble matter, and heavy metal data mean for textile printing paste performance — and when higher purity is worth specifying over a standard industrial grade.
Share the product name, application, quantity, destination and any TDS,
sample photo or document you already have. FSX Chemical will review the
information and recommend the next step for quotation, sample matching
or product selection.
Product InformationProduct name, grade, model, label photo or supplier reference.
Available DocumentsTDS, SDS, COA, sample photo, product list or test data.
Order DetailsEstimated quantity, packaging, destination country, port or trade term.
Application or IssueTextile printing process, formulation need, current issue or target performance.