Dosis ng Likidong Pangpalapot na Acrylic laban sa Lapot: Paano Bumuo ng Gumaganang Kurba para sa Pagpi-print ng Pigment
Acrylic liquid thickener dosage and viscosity are not reliably linear. Mills should build a controlled...
Acrylic liquid thickener dosage and pigment-printing viscosity are strongly related, but the relationship should not be treated as a simple straight line. A small dosage increase can produce a large viscosity increase once the polymer reaches an effective swelling and interaction region, while the same dosage can give very different results when pH, active solids, pigment, binder, electrolytes, temperature or shear conditions change. The useful production tool is therefore not a universal “recommended dosage” but a mill-specific dosage–viscosity working curve built with the actual commercial thickener and complete pigment formula. This guide shows how to build that curve, convert as-supplied dosage into active polymer solids, connect viscosity with screen rheology and finished fabric, and select the lowest practical dosage that remains stable in production.
How Should a Mill Relate Acrylic Thickener Dosage to Viscosity?
Acrylic liquid thickener dosage should be evaluated through a controlled working curve rather than one fixed percentage.
The correct production dosage is normally the lowest stable level that:
Reaches the required complete-paste rheology
Remains stable after pigment and binder addition
Runs cleanly on the intended screen machine
Controls penetration and spreading
Maintains the required rubbing fastness and hand after curing
It is not automatically the dosage that creates the highest viscosity in water.
Why Dosage and Viscosity Are Not Reliably Linear
A common assumption is:
Double the thickener dosage → Double the viscosity.
That is not a reliable rule for polymeric thickeners.
As acrylic or polyacrylate thickener concentration increases, the swollen polymer structures occupy more volume and interact more strongly.
Depending on the commercial grade, viscosity can increase slowly at low dosage and then rise much more steeply once the polymer enters a more effective thickening region.
Published polyacrylate-thickener research has specifically measured printing-paste viscosity across different thickener concentrations, and commercial pigment-printing products also specify dosage ranges rather than one universal dosage because machine, binder, pigment and target viscosity change the final requirement.
But it does not prove pigment-printing performance.
A grade that gives excellent water viscosity can lose substantial efficiency after pigment, binder or electrolyte is added.
Curve B: Complete Pigment Paste
The second curve is more important for production.
Use the real or representative:
Pigment dispersion
Binder
Fixer
Defoamer
Other essential auxiliaries
Keep the non-thickener formulation constant while changing only the thickener dosage.
At each point, record:
Final pH
Fresh viscosity
Viscosidad sa oras ng paghawak
Mukha
Bula
Now the curve becomes:
Thickener Dosage → Complete-Paste Viscosity
This is the curve that should guide production dosage.
Why Electrolytes Can Shift the Curve
Polyacrylate thickeners often contain charged carboxylate groups.
Electrolytes can reduce the effective electrostatic repulsion that helps keep the polymer expanded.
The result can be lower thickening efficiency.
Electrolytes can enter from:
Pigment dispersion
Binder
Fixer
Water hardness
Other auxiliaries
This means the same 1.5% dosage, for example, can give different viscosity in two formulas with different ionic load.
Do not reuse a dosage curve after a major binder, pigment or fixer change without rechecking the relevant points.
Why Binder Level Can Shift the Curve
Binder affects:
Water fraction
Electrolyte load
Surfactant balance
Total solids
Viscoelastic response
Therefore, a dosage curve built at one binder level may not predict another binder formulation.
If the mill uses several binder levels for different rubbing-fastness targets, build the main thickener curve around the most commercially important binder condition.
rather than one exact dosage and one exact viscosity.
A useful working window should tolerate normal process variation without causing major screen or print defects.
How Dosage Changes Screen Printing Performance
As dosage rises, low-shear body usually increases.
This can improve:
Edge control
Anti-spreading
Rest stability
But excessive dosage can cause:
Difficult pumping
High squeegee pressure
Poor screen transfer
Excess elasticity / stringiness
Hindi pantay na matitigas na bahagi
Therefore, viscosity must be linked to the full screen rheology rather than increased without limit.
How Dosage Can Change Print Definition
Insufficient dosage can leave the paste too fluid after transfer.
Possible symptoms include:
Bleeding
Haloing
Fine-line loss
Higher dosage can improve definition up to the useful rheological range.
Beyond that range, poor leveling or excessive elasticity can create:
Mesh marks
Rough solid areas
Poor release
The best print definition comes from balanced shear thinning and recovery—not simply the highest static viscosity.
How Dosage Can Change Penetration and Surface Color
Thickener dosage can change how far the pigment-binder paste moves into the fabric.
Too little structure can encourage deeper penetration.
This can reduce:
Surface color concentration
Edge definition
Too much structure can keep paste excessively on the surface or reduce leveling.
The preferred penetration depends on:
Fabric construction
Fabric absorbency
Design coverage
Binder level
Evaluate the printed fabric, not viscosity alone.
How Dosage Can Change Fabric Hand
Pigment printing already deposits binder polymer on the fabric.
Increasing thickener dosage adds more polymer solids.
At excessive levels, total polymer deposit can contribute to:
Stiffer hand
Heavier surface feel
Higher chemical cost
This is why “use more thickener until viscosity looks right” is not an ideal production strategy.
The preferred dosage should achieve rheology with the lowest practical additional polymer solids.
How to Compare Two Acrylic Thickener Grades Fairly
Do not compare two products only at equal as-supplied dosage.
Instead:
Review product solids.
Build a dosage–viscosity curve for Grade A.
Build the same curve for Grade B.
Identify the dosage each grade needs to reach the same useful complete-paste rheology window.
Print both formulas.
Compare finished fabric.
Then compare:
As-supplied dosage
Active polymer dosage
Neutralizer usage
Pagpapanatili ng katatagan
Screen performance
Fabric hand
Cost
Same dosage does not mean a fair comparison.
Convert the Curve into Total Cost in Use
Start with:
Thickener Cost per 100 kg Paste = As-Supplied Dosage × Thickener Price
Then include:
Neutralizer
Paghalo
Machine efficiency
Screen cleaning
Pagpapagaling
Rework
Finished hand / quality loss
A broader model is:
Total Cost in Use = Thickener + Neutralizer + Preparation + Printing Efficiency + Curing + Rework + Quality Loss
A more expensive product can be lower cost if it reaches the approved rheology at lower dosage and remains stable with pigment and binder.
A low-priced product can be more expensive if it requires more dosage or creates more corrections.
Use the Curve for Incoming QC and Production Adjustment
Once the grade is commercially approved, keep the working curve as a production reference.
If an incoming batch is inside specification but production viscosity shifts slightly, the curve can help estimate whether a small dosage adjustment is technically reasonable.
Before adjusting, confirm:
Incoming solids
pH
Tubig
Pigment/binder lot
Temperatura
Test method
Do not use the curve to justify large dosage changes outside the validated region.
Troubleshooting Table
Napansin na Problema
First Variables to Check
Do Not Assume
Small dosage increase causes a large viscosity jump
Steep part of curve, pH, mixing
Dosage and viscosity are linear
Same dosage gives different viscosity between lots
Solids, pH, temperature, incoming QC
Dosage alone controls viscosity
Water curve is strong but pigment paste is weak
Electrolytes, binder, pigment, pH
More thickener is automatically needed
Higher dosage improves definition but hurts transfer
High-shear rheology, elasticity, screen
Higher viscosity is always better
Higher dosage makes fabric harsh
Polymer solids, binder, paste deposit
Hand is only a binder problem
Dark shades need more thickener
Pigment load, dilution, electrolytes
One dosage fits every shade
Same viscosity from two grades gives different print result
Shear thinning, recovery, active solids
The grades are equivalent
Production requires frequent dosage correction
Working window, incoming consistency, formula variation
The operator should keep correcting manually
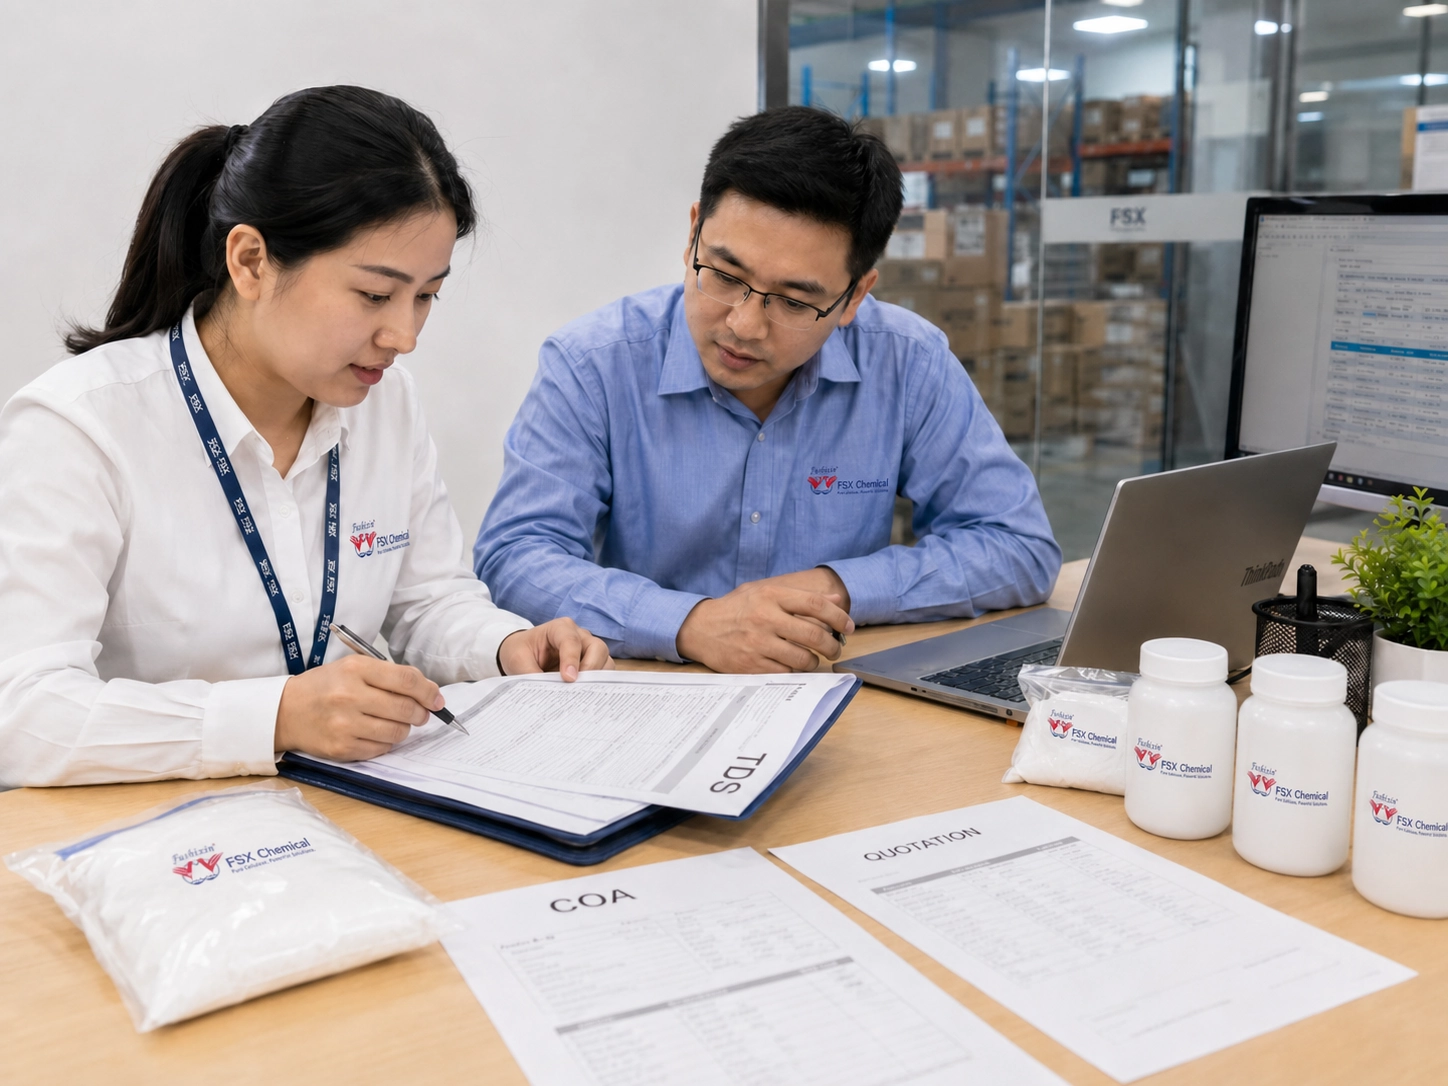
What Information Should You Send to a Thickener Supplier?
For useful dosage-curve matching, provide:
Current acrylic thickener sample, TDS or COA
Current as-supplied dosage
Product solids if available
Neutralizer / final pH
Viskosidad at kumpletong pamamaraan ng pagsubok
Pigment dispersion and dosage
Binder and dosage
Fixer / auxiliaries
Tela
Flat or rotary screen
Screen mesh / engraving
Pagpapanatili ng oras
Curing condition
Main target: viscosity, definition, penetration, hand or cost
FSX Chemical can use this information through Mga Halimbawa at Pagtutugma to define a controlled starting dosage range for laboratory evaluation.
How Should a Mill Build an Acrylic Thickener Dosage–Viscosity Working Curve?
A practical sequence is:
Fix Test Method → Fix Activation pH → Build Dosage Ladder → Measure Water Curve → Measure Complete-Paste Curve → Hold → Print → Cure → Define Working Window → Calculate Total Cost in Use
The key principles are:
Dosage and viscosity are not reliably linear.
As-supplied dosage should be distinguished from active polymer solids.
pH, pigment, binder, electrolytes, temperature and shear must be controlled.
The complete-paste curve is more important for production than the water-only curve.
The best dosage is the lowest stable dosage that meets printing and finished-fabric requirements with adequate process margin.
Compare grades by approved rheology and Total Cost in Use—not equal dosage or price per kilogram alone.
Madalas Itanong na Mga Tanong
1. Does acrylic thickener viscosity increase linearly with dosage?
Not reliably. Polymer swelling and interaction can make the dosage–viscosity relationship curved, especially near the effective thickening region.
2. What dosage should I use for acrylic pigment-printing thickener?
There is no universal percentage. Start from the commercial grade’s supplier guidance and build a controlled dosage curve in the actual pigment-binder formula.
3. Why can two acrylic thickeners use different dosages?
They can differ in active solids, polymer architecture, activation behavior, electrolyte tolerance and thickening efficiency.
4. Should two candidate grades be compared at the same dosage?
Not as the only comparison. Find the dosage each grade needs to reach the same useful complete-paste rheology, then compare printing and cost.
5. Why is water viscosity higher than pigment-paste viscosity?
Pigment, binder and auxiliaries can dilute the paste, shift pH or introduce electrolytes and surfactants that reduce thickening efficiency.
6. How many dosage points should I test?
Use several points around the expected working region—often at least five relative points—to see whether the response is linear, gradual or steep.
7. Why should I compare active polymer solids?
Liquid thickener grades can have different solids content. Equal as-supplied dosage does not necessarily mean equal active polymer addition.
8. Can higher dosage improve print definition?
It can up to the useful rheological window, but excessive dosage can reduce transfer, increase elasticity, create poor leveling and worsen fabric hand.
9. Why do dark pigment shades sometimes need a different dosage?
Higher pigment loading can add more water, dispersant, surfactant and electrolyte, shifting the complete-paste viscosity curve.
10. Should I choose the dosage that gives the highest viscosity?
No. Choose the lowest stable dosage that gives acceptable rheology, screen performance, cured fastness and fabric hand with adequate production margin.
11. Can the dosage curve be used for incoming QC?
Yes, as a reference for controlled adjustment, but only after confirming pH, solids, water, pigment/binder lots and measurement method.
12. What should I send FSX Chemical for dosage matching?
Send the current thickener or TDS, dosage, solids if known, pH/neutralizer, viscosity method, pigment, binder, fabric, machine route, holding time and main performance target.
Build a Working Dosage Curve Before Scaling Up Pigment Printing
If your acrylic liquid thickener gives unstable viscosity, requires repeated dosage correction or behaves differently between light and dark pigment shades, FSX Chemical can help structure a controlled dosage–viscosity comparison.
For a useful technical review, send:
Your current acrylic thickener sample, TDS or COA
Kasalukuyang dosis
Product solids if available
Neutralizer and final pH
Viskosidad at kumpletong pamamaraan ng pagsubok
Pigment dispersion and dosage
Binder / fixer system
Fabric and screen-printing route
Pagpapanatili ng oras
Curing condition
Current viscosity, definition, hand or cost target
The right dosage is not the amount that creates the highest viscosity in water. It is the lowest stable dosage that holds the complete pigment paste inside the approved rheology, printing and finished-fabric window.
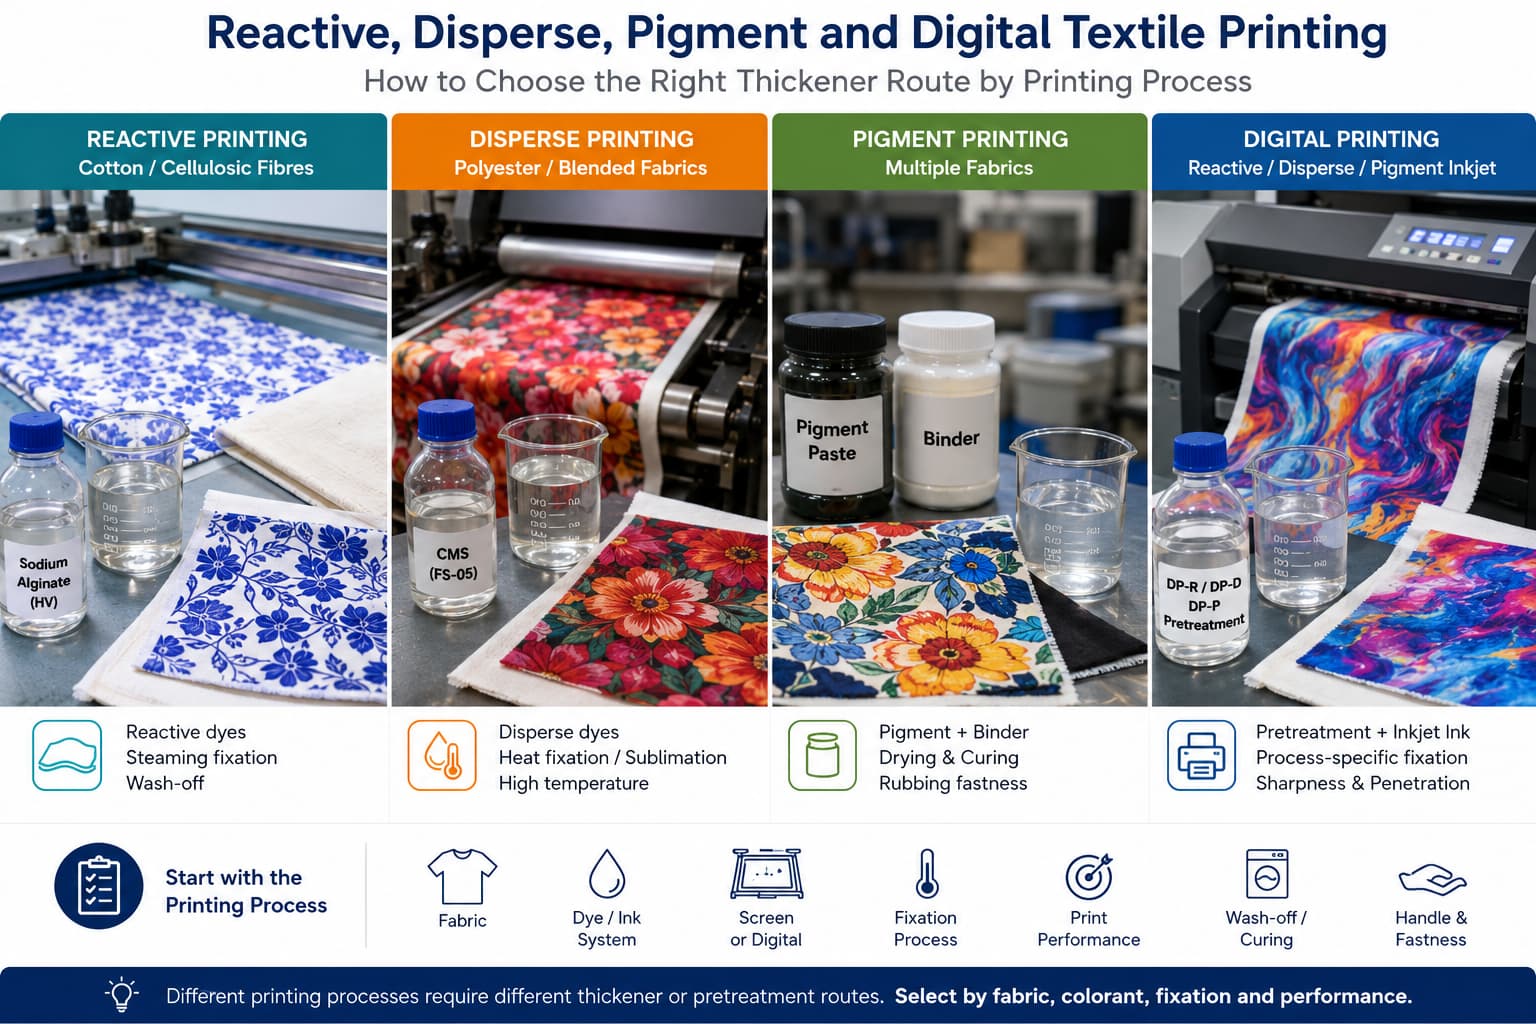
Matutong pumili ng pampatigas at mga paraan ng paunang paggamot para sa reaktibo, disperse, pigment, at digital na pagpi-print sa tela batay sa tela, tina o tinta, fiksasyon, paghuhugas, at mga kinakailangan sa kalidad ng pagpi-print.
Ang CMC-based printing paste ay ginagamit sa pigment, reactive, at digital na pagpi-print ng tela. Ipinapaliwanag ng gabay na ito kung aling mga parameter ang mahalaga, kung paano ihambing ang mga supplier, at kung ano ang dapat hilingin bago maglagay ng maramihang order.
Parehong ginagamit ang sodium alginate at CMC bilang pampalapot sa pagpi-print ng tela, ngunit angkop ang mga ito sa iba't ibang sistema ng pangkulay at kondisyon ng proseso. Ipinapaliwanag ng gabay na ito ang mga pangunahing pagkakaiba at kung kailan dapat gamitin ang bawat isa.
The right textile printing thickener is determined by more than fabric type. Buyers should match the thickener to the dye or pigment system, printing method, target rheology, wash-off requirements and actual factory trial conditions.
Ang pagganap ng pagpi-print sa tela ay nakasalalay sa isang pinag-ugnay na sistemang kemikal, hindi sa isang unibersal na additive. Ipinapaliwanag ng gabay na ito ang sampung mahahalagang pangkat ng kemikal, ang kanilang mga tungkulin, kung saan sila nagagamit, at kung ano ang dapat suriin ng mga mamimili bago ang mga pagsubok sa produksyon.
Textile printing thickeners differ in chemistry, rheology, dye compatibility and wash-off behavior. This guide compares the main thickener families, their common application directions and the parameters buyers should verify before production trials.
Ang mga digital printing paste ay dapat piliin batay sa kemistri ng tinta, tela, paraan ng aplikasyon, at post-treatment. Ikinukumpara ng gabay na ito ang sodium alginate, CMC, CMS, sintetikong polymer, at mga compound pretreatment na ruta para sa textile inkjet printing.
FSX Chemical offers separate digital printing paste routes for reactive, disperse and pigment systems, supported by application review, sample matching and technical documentation. This guide explains how buyers can evaluate the right route before bulk purchasing.
Stable digital printing paste requires more than a target viscosity. This guide explains how product selection, water quality, addition sequence, mixing, pH, temperature, filtration, hygiene, storage and quality records influence pretreatment and production consistency.
This product review examines FSX Digital Printing Paste as a textile inkjet pretreatment and thickening route, focusing on ink-system matching, rheology, filtration, print definition, stability and real production testing.
Digital textile printing requires more than advanced ink and printheads. Explore process-specific chemical solutions for reactive, disperse and pigment inkjet printing, from pretreatment and rheology to filtration, fixation and production validation.
Textile printing chemistry is evolving beyond simple viscosity and price comparisons. Explore five innovation directions shaping 2026, including safer chemical inputs, hybrid biopolymer thickeners, advanced pigment binders, shorter digital processes and multifunctional formulations.
Ibahagi ang pangalan ng produkto, aplikasyon, dami, destinasyon, at anumang TDS, larawan ng sample o dokumento na mayroon ka na. Susuriin ng FSX Chemical ang impormasyon at irekomenda ang susunod na hakbang para sa quotation, pagtutugma ng sample, o pagpili ng produkto.
Impormasyon ng ProduktoPangalan ng produkto, grado, modelo, larawan sa etiketa o sanggunian ng tagapagtustos.
Magagamit na mga dokumentoTDS, SDS, COA, larawan ng sample, listahan ng produkto o datos ng pagsubok.
Mga Detalye ng OrderTinatayang dami, pag-iimpake, bansang patutunguhan, pantalan o termino sa kalakalan.
Aplikasyon o IsyuProseso ng pagpi-print sa tela, pangangailangan sa pormulasyon, kasalukuyang isyu o target na pagganap.