Acrylic Liquid Thickener Dosage vs. Viscosity: How to Build a Working Curve for Pigment Printing
Acrylic liquid thickener dosage and viscosity are not reliably linear. Mills should build a controlled...
Acrylic liquid thickener dosage and pigment-printing viscosity are strongly related, but the relationship should not be treated as a simple straight line. A small dosage increase can produce a large viscosity increase once the polymer reaches an effective swelling and interaction region, while the same dosage can give very different results when pH, active solids, pigment, binder, electrolytes, temperature or shear conditions change. The useful production tool is therefore not a universal “recommended dosage” but a mill-specific dosage–viscosity working curve built with the actual commercial thickener and complete pigment formula. This guide shows how to build that curve, convert as-supplied dosage into active polymer solids, connect viscosity with screen rheology and finished fabric, and select the lowest practical dosage that remains stable in production.
How Should a Mill Relate Acrylic Thickener Dosage to Viscosity?
Acrylic liquid thickener dosage should be evaluated through a controlled working curve rather than one fixed percentage.
The correct production dosage is normally the lowest stable level that:
Reaches the required complete-paste rheology
Remains stable after pigment and binder addition
Runs cleanly on the intended screen machine
Controls penetration and spreading
Maintains the required rubbing fastness and hand after curing
It is not automatically the dosage that creates the highest viscosity in water.
Why Dosage and Viscosity Are Not Reliably Linear
A common assumption is:
Double the thickener dosage → Double the viscosity.
That is not a reliable rule for polymeric thickeners.
As acrylic or polyacrylate thickener concentration increases, the swollen polymer structures occupy more volume and interact more strongly.
Depending on the commercial grade, viscosity can increase slowly at low dosage and then rise much more steeply once the polymer enters a more effective thickening region.
Published polyacrylate-thickener research has specifically measured printing-paste viscosity across different thickener concentrations, and commercial pigment-printing products also specify dosage ranges rather than one universal dosage because machine, binder, pigment and target viscosity change the final requirement.
But it does not prove pigment-printing performance.
A grade that gives excellent water viscosity can lose substantial efficiency after pigment, binder or electrolyte is added.
Curve B: Complete Pigment Paste
The second curve is more important for production.
Use the real or representative:
تشتت الصبغة
مجلد
المُصلح
Defoamer
Other essential auxiliaries
Keep the non-thickener formulation constant while changing only the thickener dosage.
At each point, record:
القيمة النهائية لدرجة الحموضة (pH)
اللزوجة الحالية
Holding-time viscosity
المظهر
الرغوة
Now the curve becomes:
Thickener Dosage → Complete-Paste Viscosity
This is the curve that should guide production dosage.
Why Electrolytes Can Shift the Curve
Polyacrylate thickeners often contain charged carboxylate groups.
Electrolytes can reduce the effective electrostatic repulsion that helps keep the polymer expanded.
The result can be lower thickening efficiency.
Electrolytes can enter from:
تشتت الصبغة
مجلد
المُصلح
صلابة الماء
Other auxiliaries
This means the same 1.5% dosage, for example, can give different viscosity in two formulas with different ionic load.
Do not reuse a dosage curve after a major binder, pigment or fixer change without rechecking the relevant points.
Why Binder Level Can Shift the Curve
Binder affects:
Water fraction
كمية الإلكتروليتات
توازن المواد الخافضة للتوتر السطحي
Total solids
Viscoelastic response
Therefore, a dosage curve built at one binder level may not predict another binder formulation.
If the mill uses several binder levels for different rubbing-fastness targets, build the main thickener curve around the most commercially important binder condition.
rather than one exact dosage and one exact viscosity.
A useful working window should tolerate normal process variation without causing major screen or print defects.
How Dosage Changes Screen Printing Performance
As dosage rises, low-shear body usually increases.
This can improve:
Edge control
Anti-spreading
ثبات في وضع الراحة
But excessive dosage can cause:
صعوبة في الضخ
High squeegee pressure
Poor screen transfer
Excess elasticity / stringiness
المناطق الصلبة غير المتساوية
Therefore, viscosity must be linked to the full screen rheology rather than increased without limit.
How Dosage Can Change Print Definition
Insufficient dosage can leave the paste too fluid after transfer.
تشمل الأعراض المحتملة ما يلي:
النزيف
تكوّن الهالة
Fine-line loss
Higher dosage can improve definition up to the useful rheological range.
Beyond that range, poor leveling or excessive elasticity can create:
علامات الشبكة
Rough solid areas
Poor release
The best print definition comes from balanced shear thinning and recovery—not simply the highest static viscosity.
How Dosage Can Change Penetration and Surface Color
Thickener dosage can change how far the pigment-binder paste moves into the fabric.
Too little structure can encourage deeper penetration.
This can reduce:
Surface color concentration
تعريف الحافة
Too much structure can keep paste excessively on the surface or reduce leveling.
يعتمد الاختراق المفضل على:
تركيب النسيج
Fabric absorbency
Design coverage
Binder level
Evaluate the printed fabric, not viscosity alone.
How Dosage Can Change Fabric Hand
Pigment printing already deposits binder polymer on the fabric.
Increasing thickener dosage adds more polymer solids.
At excessive levels, total polymer deposit can contribute to:
Stiffer hand
Heavier surface feel
Higher chemical cost
This is why “use more thickener until viscosity looks right” is not an ideal production strategy.
The preferred dosage should achieve rheology with the lowest practical additional polymer solids.
How to Compare Two Acrylic Thickener Grades Fairly
Do not compare two products only at equal as-supplied dosage.
Instead:
Review product solids.
Build a dosage–viscosity curve for Grade A.
Build the same curve for Grade B.
Identify the dosage each grade needs to reach the same useful complete-paste rheology window.
Print both formulas.
Compare finished fabric.
ثم قارن بين:
As-supplied dosage
Active polymer dosage
Neutralizer usage
استقرار الحيازة
Screen performance
نسيج يدوي
Cost
Same dosage does not mean a fair comparison.
Convert the Curve into Total Cost in Use
Start with:
Thickener Cost per 100 kg Paste = As-Supplied Dosage × Thickener Price
Then include:
مُحايدٌ
الخلط
Machine efficiency
تنظيف الشاشة
المعالجة
إعادة العمل
Finished hand / quality loss
A broader model is:
Total Cost in Use = Thickener + Neutralizer + Preparation + Printing Efficiency + Curing + Rework + Quality Loss
A more expensive product can be lower cost if it reaches the approved rheology at lower dosage and remains stable with pigment and binder.
A low-priced product can be more expensive if it requires more dosage or creates more corrections.
Use the Curve for Incoming QC and Production Adjustment
Once the grade is commercially approved, keep the working curve as a production reference.
If an incoming batch is inside specification but production viscosity shifts slightly, the curve can help estimate whether a small dosage adjustment is technically reasonable.
Before adjusting, confirm:
Incoming solids
الرقم الهيدروجيني
الماء
Pigment/binder lot
درجة الحرارة
Test method
Do not use the curve to justify large dosage changes outside the validated region.
جدول استكشاف الأعطال وإصلاحها
المشكلة الملاحظة
المتغيرات الأولى التي يجب التحقق منها
لا تفترض
Small dosage increase causes a large viscosity jump
Steep part of curve, pH, mixing
Dosage and viscosity are linear
Same dosage gives different viscosity between lots
Solids, pH, temperature, incoming QC
Dosage alone controls viscosity
Water curve is strong but pigment paste is weak
Electrolytes, binder, pigment, pH
More thickener is automatically needed
Higher dosage improves definition but hurts transfer
High-shear rheology, elasticity, screen
Higher viscosity is always better
Higher dosage makes fabric harsh
Polymer solids, binder, paste deposit
Hand is only a binder problem
Dark shades need more thickener
Pigment load, dilution, electrolytes
One dosage fits every shade
Same viscosity from two grades gives different print result
Shear thinning, recovery, active solids
The grades are equivalent
Production requires frequent dosage correction
Working window, incoming consistency, formula variation
The operator should keep correcting manually
ما هي المعلومات التي يجب عليك إرسالها إلى مورد مواد التكاثف؟
For useful dosage-curve matching, provide:
Current acrylic thickener sample, TDS or COA
Current as-supplied dosage
Product solids if available
Neutralizer / final pH
اللزوجة وطريقة الاختبار الكاملة
Pigment dispersion and dosage
Binder and dosage
Fixer / auxiliaries
القماش
غربال مسطح أو دوار
شبكة الشاشة / النقش
مدة الانتظار
Curing condition
Main target: viscosity, definition, penetration, hand or cost
يمكن لشركة FSX Chemical الاستفادة من هذه المعلومات من خلال العينات والمطابقة to define a controlled starting dosage range for laboratory evaluation.
How Should a Mill Build an Acrylic Thickener Dosage–Viscosity Working Curve?
إحدى الخطوات العملية هي:
Fix Test Method → Fix Activation pH → Build Dosage Ladder → Measure Water Curve → Measure Complete-Paste Curve → Hold → Print → Cure → Define Working Window → Calculate Total Cost in Use
المبادئ الأساسية هي:
Dosage and viscosity are not reliably linear.
As-supplied dosage should be distinguished from active polymer solids.
pH, pigment, binder, electrolytes, temperature and shear must be controlled.
The complete-paste curve is more important for production than the water-only curve.
The best dosage is the lowest stable dosage that meets printing and finished-fabric requirements with adequate process margin.
Compare grades by approved rheology and Total Cost in Use—not equal dosage or price per kilogram alone.
الأسئلة الشائعة
1. Does acrylic thickener viscosity increase linearly with dosage?
Not reliably. Polymer swelling and interaction can make the dosage–viscosity relationship curved, especially near the effective thickening region.
2. What dosage should I use for acrylic pigment-printing thickener?
There is no universal percentage. Start from the commercial grade’s supplier guidance and build a controlled dosage curve in the actual pigment-binder formula.
3. Why can two acrylic thickeners use different dosages?
They can differ in active solids, polymer architecture, activation behavior, electrolyte tolerance and thickening efficiency.
4. Should two candidate grades be compared at the same dosage?
Not as the only comparison. Find the dosage each grade needs to reach the same useful complete-paste rheology, then compare printing and cost.
5. Why is water viscosity higher than pigment-paste viscosity?
Pigment, binder and auxiliaries can dilute the paste, shift pH or introduce electrolytes and surfactants that reduce thickening efficiency.
6. How many dosage points should I test?
Use several points around the expected working region—often at least five relative points—to see whether the response is linear, gradual or steep.
7. Why should I compare active polymer solids?
Liquid thickener grades can have different solids content. Equal as-supplied dosage does not necessarily mean equal active polymer addition.
8. Can higher dosage improve print definition?
It can up to the useful rheological window, but excessive dosage can reduce transfer, increase elasticity, create poor leveling and worsen fabric hand.
9. Why do dark pigment shades sometimes need a different dosage?
Higher pigment loading can add more water, dispersant, surfactant and electrolyte, shifting the complete-paste viscosity curve.
10. Should I choose the dosage that gives the highest viscosity?
No. Choose the lowest stable dosage that gives acceptable rheology, screen performance, cured fastness and fabric hand with adequate production margin.
11. Can the dosage curve be used for incoming QC?
Yes, as a reference for controlled adjustment, but only after confirming pH, solids, water, pigment/binder lots and measurement method.
12. What should I send FSX Chemical for dosage matching?
Send the current thickener or TDS, dosage, solids if known, pH/neutralizer, viscosity method, pigment, binder, fabric, machine route, holding time and main performance target.
Build a Working Dosage Curve Before Scaling Up Pigment Printing
If your acrylic liquid thickener gives unstable viscosity, requires repeated dosage correction or behaves differently between light and dark pigment shades, FSX Chemical can help structure a controlled dosage–viscosity comparison.
For a useful technical review, send:
Your current acrylic thickener sample, TDS or COA
الجرعة الحالية
Product solids if available
Neutralizer and final pH
اللزوجة وطريقة الاختبار الكاملة
Pigment dispersion and dosage
نظام المُثبِّت/المُثبِّت
Fabric and screen-printing route
مدة الانتظار
Curing condition
Current viscosity, definition, hand or cost target
ابدأ بـ العينات والمطابقة for a controlled current-vs-candidate trial.
The right dosage is not the amount that creates the highest viscosity in water. It is the lowest stable dosage that holds the complete pigment paste inside the approved rheology, printing and finished-fabric window.
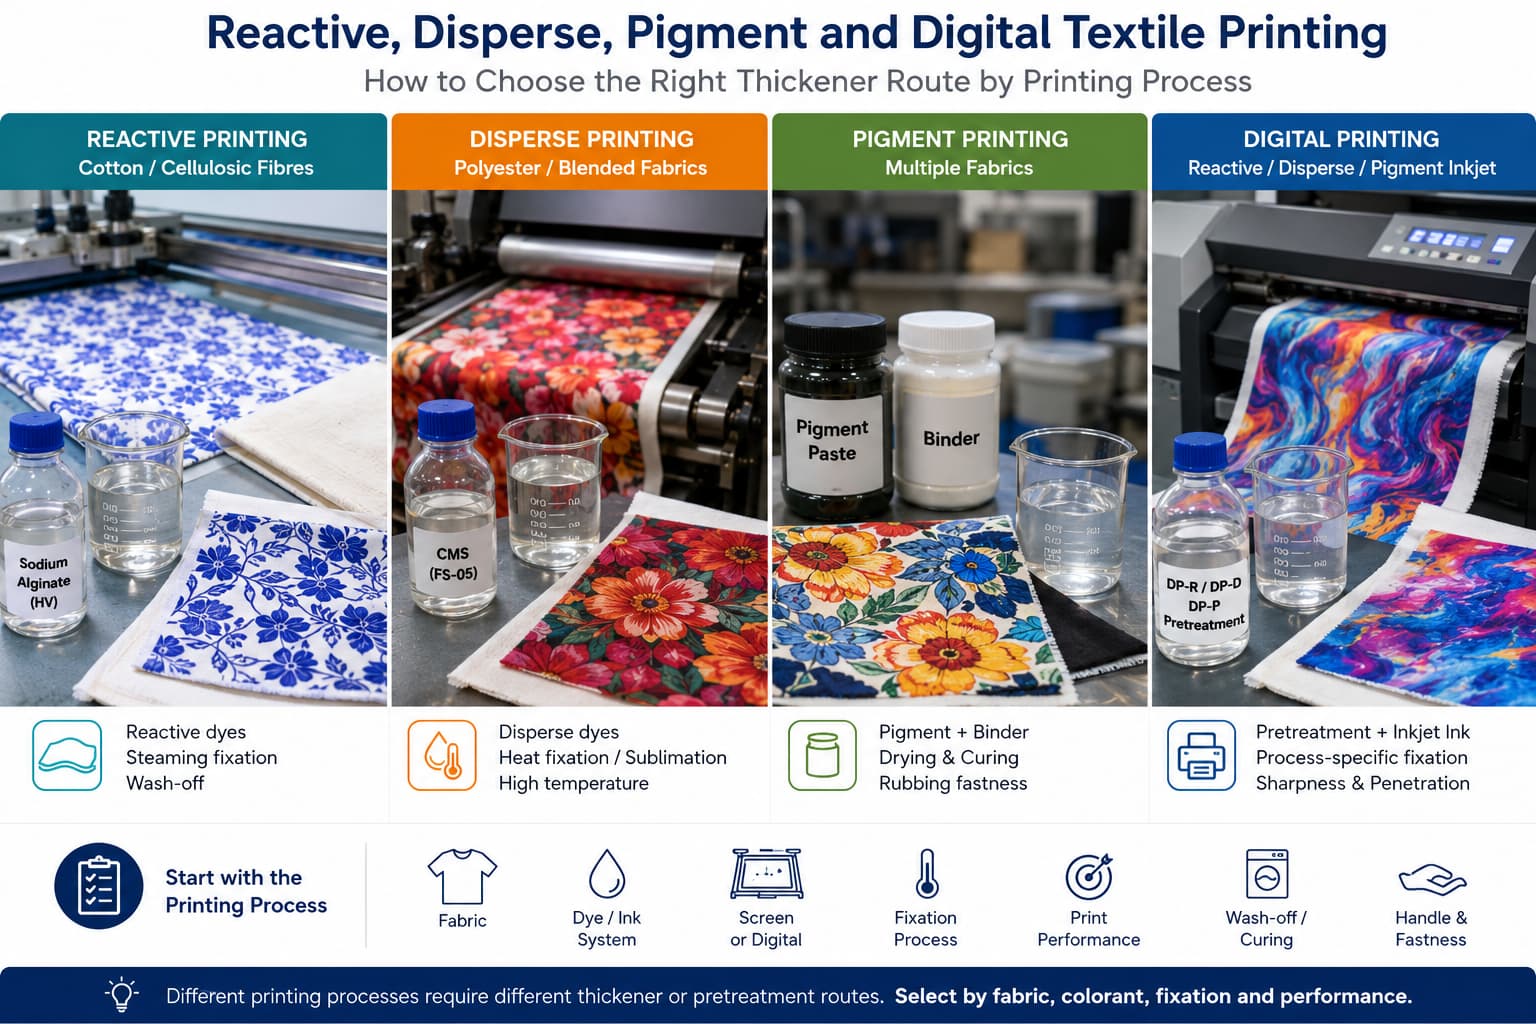
تعرف على كيفية اختيار المُكثِّف وطرق المعالجة المسبقة للطباعة النسيجية التفاعلية، والطباعة بالتشتت، والطباعة بالصبغات، والطباعة الرقمية، بناءً على متطلبات النسيج، والصبغة أو الحبر، والتثبيت، وقابلية الغسل، وجودة الطباعة.
يُستخدم معجون الطباعة الذي يعتمد على مادة CMC في طباعة المنسوجات بالأصباغ، والطباعة التفاعلية، والطباعة الرقمية. يشرح هذا الدليل المعلمات المهمة، وكيفية مقارنة الموردين، وما يجب طلبه قبل تقديم طلب شراء بالجملة.
يُستخدم كل من ألجينات الصوديوم وCMC كمكثفات في طباعة المنسوجات، لكنهما يناسبان أنظمة صبغ وظروف معالجة مختلفة. يشرح هذا الدليل الاختلافات الرئيسية بينهما ومتى يتم استخدام كل منهما.
لا يقتصر اختيار المكثف المناسب لطباعة المنسوجات على نوع القماش فحسب. بل يجب على المشترين مطابقة المكثف مع نظام الصبغة أو الصبغات، وطريقة الطباعة، والخصائص الريولوجية المستهدفة، ومتطلبات مقاومة الغسل، وظروف التجارب الفعلية في المصنع.
يعتمد أداء طباعة المنسوجات على نظام كيميائي متناسق، وليس على مادة مضافة واحدة شاملة. يشرح هذا الدليل عشر مجموعات كيميائية مهمة، ووظائفها، وأين يتم استخدامها، وما يجب على المشترين التحقق منه قبل إجراء تجارب الإنتاج.
تختلف مواد التكثيف المستخدمة في طباعة المنسوجات من حيث التركيب الكيميائي، وخصائص الريولوجيا، والتوافق مع الأصباغ، وسلوكها عند الغسل. يقارن هذا الدليل بين المجموعات الرئيسية لمواد التكثيف، وتوجيهات الاستخدام الشائعة لها، والمعايير التي يجب على المشترين التحقق منها قبل إجراء تجارب الإنتاج.
ينبغي اختيار معاجين الطباعة الرقمية بناءً على التركيب الكيميائي للحبر، ونوع النسيج، وطريقة التطبيق، والمعالجة اللاحقة. يقارن هذا الدليل طرق المعالجة المسبقة باستخدام ألجينات الصوديوم، وCMC، وCMS، والبوليمر الصناعي، والمركبات، في مجال الطباعة النسيجية بنظام نفث الحبر.
FSX Chemical offers separate digital printing paste routes for reactive, disperse and pigment systems, supported by application review, sample matching and technical documentation. This guide explains how buyers can evaluate the right route before bulk purchasing.
لا يقتصر الأمر في الحصول على معجون طباعة رقمي مستقر على مجرد تحقيق اللزوجة المستهدفة. يشرح هذا الدليل كيف تؤثر عوامل مثل اختيار المنتج، وجودة المياه، وتسلسل إضافة المكونات، والخلط، ودرجة الحموضة، ودرجة الحرارة، والترشيح، والنظافة، والتخزين، وسجلات الجودة على المعالجة المسبقة واتساق الإنتاج.
This product review examines FSX Digital Printing Paste as a textile inkjet pretreatment and thickening route, focusing on ink-system matching, rheology, filtration, print definition, stability and real production testing.
Digital textile printing requires more than advanced ink and printheads. Explore process-specific chemical solutions for reactive, disperse and pigment inkjet printing, from pretreatment and rheology to filtration, fixation and production validation.
Textile printing chemistry is evolving beyond simple viscosity and price comparisons. Explore five innovation directions shaping 2026, including safer chemical inputs, hybrid biopolymer thickeners, advanced pigment binders, shorter digital processes and multifunctional formulations.
يرجى إرسال اسم المنتج، والتطبيق، والكمية، والوجهة، وأي بيانات تقنية (TDS)،
أو صورة عينة أو مستند متوفر لديكم بالفعل. وستقوم شركة FSX Chemical بمراجعة
هذه المعلومات وتقديم توصية بشأن الخطوة التالية سواء كانت تقديم عرض أسعار، أو مطابقة العينة،
أو اختيار المنتج.
معلومات عن المنتجاسم المنتج، الدرجة، الطراز، صورة الملصق أو مرجع المورد.
الوثائق المتاحةTDS، SDS، COA، صورة العينة، قائمة المنتجات أو بيانات الاختبار.
تفاصيل الطلبالكمية التقديرية، والتعبئة، وبلد المقصد، والميناء، أو الشروط التجارية.
الطلب أو المشكلةعملية طباعة المنسوجات، متطلبات التركيبة، المشكلات الحالية أو الأداء المستهدف.