Liều lượng chất làm đặc lỏng acrylic so với độ nhớt: Cách xây dựng đường cong làm việc cho in pigment
Acrylic liquid thickener dosage and viscosity are not reliably linear. Mills should build a controlled...
Acrylic liquid thickener dosage and pigment-printing viscosity are strongly related, but the relationship should not be treated as a simple straight line. A small dosage increase can produce a large viscosity increase once the polymer reaches an effective swelling and interaction region, while the same dosage can give very different results when pH, active solids, pigment, binder, electrolytes, temperature or shear conditions change. The useful production tool is therefore not a universal “recommended dosage” but a mill-specific dosage–viscosity working curve built with the actual commercial thickener and complete pigment formula. This guide shows how to build that curve, convert as-supplied dosage into active polymer solids, connect viscosity with screen rheology and finished fabric, and select the lowest practical dosage that remains stable in production.
How Should a Mill Relate Acrylic Thickener Dosage to Viscosity?
Acrylic liquid thickener dosage should be evaluated through a controlled working curve rather than one fixed percentage.
The correct production dosage is normally the lowest stable level that:
Reaches the required complete-paste rheology
Remains stable after pigment and binder addition
Runs cleanly on the intended screen machine
Controls penetration and spreading
Maintains the required rubbing fastness and hand after curing
It is not automatically the dosage that creates the highest viscosity in water.
Why Dosage and Viscosity Are Not Reliably Linear
A common assumption is:
Double the thickener dosage → Double the viscosity.
That is not a reliable rule for polymeric thickeners.
As acrylic or polyacrylate thickener concentration increases, the swollen polymer structures occupy more volume and interact more strongly.
Depending on the commercial grade, viscosity can increase slowly at low dosage and then rise much more steeply once the polymer enters a more effective thickening region.
Published polyacrylate-thickener research has specifically measured printing-paste viscosity across different thickener concentrations, and commercial pigment-printing products also specify dosage ranges rather than one universal dosage because machine, binder, pigment and target viscosity change the final requirement.
But it does not prove pigment-printing performance.
A grade that gives excellent water viscosity can lose substantial efficiency after pigment, binder or electrolyte is added.
Curve B: Complete Pigment Paste
The second curve is more important for production.
Use the real or representative:
Dung dịch phân tán sắc tố
Binder
Fixer
Defoamer
Other essential auxiliaries
Keep the non-thickener formulation constant while changing only the thickener dosage.
At each point, record:
Giá trị pH cuối cùng
Độ nhớt ban đầu
Độ nhớt theo thời gian giữ
Hình thức
Bọt
Now the curve becomes:
Thickener Dosage → Complete-Paste Viscosity
This is the curve that should guide production dosage.
Why Electrolytes Can Shift the Curve
Polyacrylate thickeners often contain charged carboxylate groups.
Electrolytes can reduce the effective electrostatic repulsion that helps keep the polymer expanded.
The result can be lower thickening efficiency.
Electrolytes can enter from:
Dung dịch phân tán sắc tố
Binder
Fixer
Độ cứng của nước
Other auxiliaries
This means the same 1.5% dosage, for example, can give different viscosity in two formulas with different ionic load.
Do not reuse a dosage curve after a major binder, pigment or fixer change without rechecking the relevant points.
Why Binder Level Can Shift the Curve
Binder affects:
Water fraction
Lượng chất điện giải
Cân bằng chất hoạt động bề mặt
Total solids
Viscoelastic response
Therefore, a dosage curve built at one binder level may not predict another binder formulation.
If the mill uses several binder levels for different rubbing-fastness targets, build the main thickener curve around the most commercially important binder condition.
rather than one exact dosage and one exact viscosity.
A useful working window should tolerate normal process variation without causing major screen or print defects.
How Dosage Changes Screen Printing Performance
As dosage rises, low-shear body usually increases.
This can improve:
Edge control
Anti-spreading
Rest stability
But excessive dosage can cause:
Difficult pumping
High squeegee pressure
Poor screen transfer
Excess elasticity / stringiness
Uneven solid areas
Therefore, viscosity must be linked to the full screen rheology rather than increased without limit.
How Dosage Can Change Print Definition
Insufficient dosage can leave the paste too fluid after transfer.
Possible symptoms include:
Bleeding
Haloing
Fine-line loss
Higher dosage can improve definition up to the useful rheological range.
Beyond that range, poor leveling or excessive elasticity can create:
Mesh marks
Rough solid areas
Poor release
The best print definition comes from balanced shear thinning and recovery—not simply the highest static viscosity.
How Dosage Can Change Penetration and Surface Color
Thickener dosage can change how far the pigment-binder paste moves into the fabric.
Too little structure can encourage deeper penetration.
This can reduce:
Surface color concentration
Edge definition
Too much structure can keep paste excessively on the surface or reduce leveling.
The preferred penetration depends on:
Fabric construction
Fabric absorbency
Design coverage
Binder level
Evaluate the printed fabric, not viscosity alone.
How Dosage Can Change Fabric Hand
Pigment printing already deposits binder polymer on the fabric.
Increasing thickener dosage adds more polymer solids.
At excessive levels, total polymer deposit can contribute to:
Stiffer hand
Heavier surface feel
Higher chemical cost
This is why “use more thickener until viscosity looks right” is not an ideal production strategy.
The preferred dosage should achieve rheology with the lowest practical additional polymer solids.
How to Compare Two Acrylic Thickener Grades Fairly
Do not compare two products only at equal as-supplied dosage.
Instead:
Review product solids.
Build a dosage–viscosity curve for Grade A.
Build the same curve for Grade B.
Identify the dosage each grade needs to reach the same useful complete-paste rheology window.
Print both formulas.
Compare finished fabric.
Sau đó, hãy so sánh:
As-supplied dosage
Active polymer dosage
Neutralizer usage
Duy trì sự ổn định
Screen performance
Vải dệt tay
Cost
Same dosage does not mean a fair comparison.
Convert the Curve into Total Cost in Use
Start with:
Thickener Cost per 100 kg Paste = As-Supplied Dosage × Thickener Price
Then include:
Chất trung hòa
Trộn
Machine efficiency
Vệ sinh màn hình
Quá trình làm cứng
Sửa lại
Finished hand / quality loss
A broader model is:
Total Cost in Use = Thickener + Neutralizer + Preparation + Printing Efficiency + Curing + Rework + Quality Loss
A more expensive product can be lower cost if it reaches the approved rheology at lower dosage and remains stable with pigment and binder.
A low-priced product can be more expensive if it requires more dosage or creates more corrections.
Use the Curve for Incoming QC and Production Adjustment
Once the grade is commercially approved, keep the working curve as a production reference.
If an incoming batch is inside specification but production viscosity shifts slightly, the curve can help estimate whether a small dosage adjustment is technically reasonable.
Before adjusting, confirm:
Incoming solids
pH
Nước
Pigment/binder lot
Nhiệt độ
Test method
Do not use the curve to justify large dosage changes outside the validated region.
Bảng khắc phục sự cố
Vấn đề được ghi nhận
Các biến cần kiểm tra trước tiên
Đừng vội kết luận
Small dosage increase causes a large viscosity jump
Steep part of curve, pH, mixing
Dosage and viscosity are linear
Same dosage gives different viscosity between lots
Solids, pH, temperature, incoming QC
Dosage alone controls viscosity
Water curve is strong but pigment paste is weak
Electrolytes, binder, pigment, pH
More thickener is automatically needed
Higher dosage improves definition but hurts transfer
High-shear rheology, elasticity, screen
Higher viscosity is always better
Higher dosage makes fabric harsh
Polymer solids, binder, paste deposit
Hand is only a binder problem
Dark shades need more thickener
Hàm lượng sắc tố, độ pha loãng, chất điện giải
One dosage fits every shade
Same viscosity from two grades gives different print result
Shear thinning, recovery, active solids
The grades are equivalent
Production requires frequent dosage correction
Working window, incoming consistency, formula variation
The operator should keep correcting manually
Bạn nên cung cấp những thông tin nào cho nhà cung cấp chất làm đặc?
For useful dosage-curve matching, provide:
Current acrylic thickener sample, TDS or COA
Current as-supplied dosage
Hàm lượng chất rắn trong sản phẩm (nếu có)
Neutralizer / final pH
Độ nhớt và phương pháp thử nghiệm toàn diện
Sự phân tán và liều lượng của chất màu
Binder and dosage
Thiết bị cố định / thiết bị phụ trợ
Vải
Rây phẳng hoặc rây quay
Screen mesh / engraving
Thời gian giữ
Curing condition
Main target: viscosity, definition, penetration, hand or cost
FSX Chemical có thể sử dụng thông tin này thông qua Mẫu và việc kết hợp to define a controlled starting dosage range for laboratory evaluation.
How Should a Mill Build an Acrylic Thickener Dosage–Viscosity Working Curve?
A practical sequence is:
Fix Test Method → Fix Activation pH → Build Dosage Ladder → Measure Water Curve → Measure Complete-Paste Curve → Hold → Print → Cure → Define Working Window → Calculate Total Cost in Use
Các nguyên tắc chính là:
Dosage and viscosity are not reliably linear.
As-supplied dosage should be distinguished from active polymer solids.
pH, pigment, binder, electrolytes, temperature and shear must be controlled.
The complete-paste curve is more important for production than the water-only curve.
The best dosage is the lowest stable dosage that meets printing and finished-fabric requirements with adequate process margin.
Compare grades by approved rheology and Total Cost in Use—not equal dosage or price per kilogram alone.
Các câu hỏi thường gặp
1. Does acrylic thickener viscosity increase linearly with dosage?
Not reliably. Polymer swelling and interaction can make the dosage–viscosity relationship curved, especially near the effective thickening region.
2. What dosage should I use for acrylic pigment-printing thickener?
There is no universal percentage. Start from the commercial grade’s supplier guidance and build a controlled dosage curve in the actual pigment-binder formula.
3. Why can two acrylic thickeners use different dosages?
They can differ in active solids, polymer architecture, activation behavior, electrolyte tolerance and thickening efficiency.
4. Should two candidate grades be compared at the same dosage?
Not as the only comparison. Find the dosage each grade needs to reach the same useful complete-paste rheology, then compare printing and cost.
5. Why is water viscosity higher than pigment-paste viscosity?
Pigment, binder and auxiliaries can dilute the paste, shift pH or introduce electrolytes and surfactants that reduce thickening efficiency.
6. How many dosage points should I test?
Use several points around the expected working region—often at least five relative points—to see whether the response is linear, gradual or steep.
7. Why should I compare active polymer solids?
Liquid thickener grades can have different solids content. Equal as-supplied dosage does not necessarily mean equal active polymer addition.
8. Can higher dosage improve print definition?
It can up to the useful rheological window, but excessive dosage can reduce transfer, increase elasticity, create poor leveling and worsen fabric hand.
9. Why do dark pigment shades sometimes need a different dosage?
Higher pigment loading can add more water, dispersant, surfactant and electrolyte, shifting the complete-paste viscosity curve.
10. Should I choose the dosage that gives the highest viscosity?
No. Choose the lowest stable dosage that gives acceptable rheology, screen performance, cured fastness and fabric hand with adequate production margin.
11. Can the dosage curve be used for incoming QC?
Yes, as a reference for controlled adjustment, but only after confirming pH, solids, water, pigment/binder lots and measurement method.
12. What should I send FSX Chemical for dosage matching?
Send the current thickener or TDS, dosage, solids if known, pH/neutralizer, viscosity method, pigment, binder, fabric, machine route, holding time and main performance target.
Build a Working Dosage Curve Before Scaling Up Pigment Printing
If your acrylic liquid thickener gives unstable viscosity, requires repeated dosage correction or behaves differently between light and dark pigment shades, FSX Chemical can help structure a controlled dosage–viscosity comparison.
Để nhận được bài đánh giá kỹ thuật hữu ích, vui lòng gửi:
Your current acrylic thickener sample, TDS or COA
Liều lượng hiện tại
Hàm lượng chất rắn trong sản phẩm (nếu có)
Chất trung hòa và độ pH cuối cùng
Độ nhớt và phương pháp thử nghiệm toàn diện
Sự phân tán và liều lượng của chất màu
Hệ thống chất kết dính / chất cố định
Fabric and screen-printing route
Thời gian giữ
Curing condition
Current viscosity, definition, hand or cost target
Bắt đầu bằng Mẫu và việc kết hợp để tiến hành một thử nghiệm có đối chứng so sánh giữa nhóm đối chứng và nhóm thí nghiệm.
The right dosage is not the amount that creates the highest viscosity in water. It is the lowest stable dosage that holds the complete pigment paste inside the approved rheology, printing and finished-fabric window.
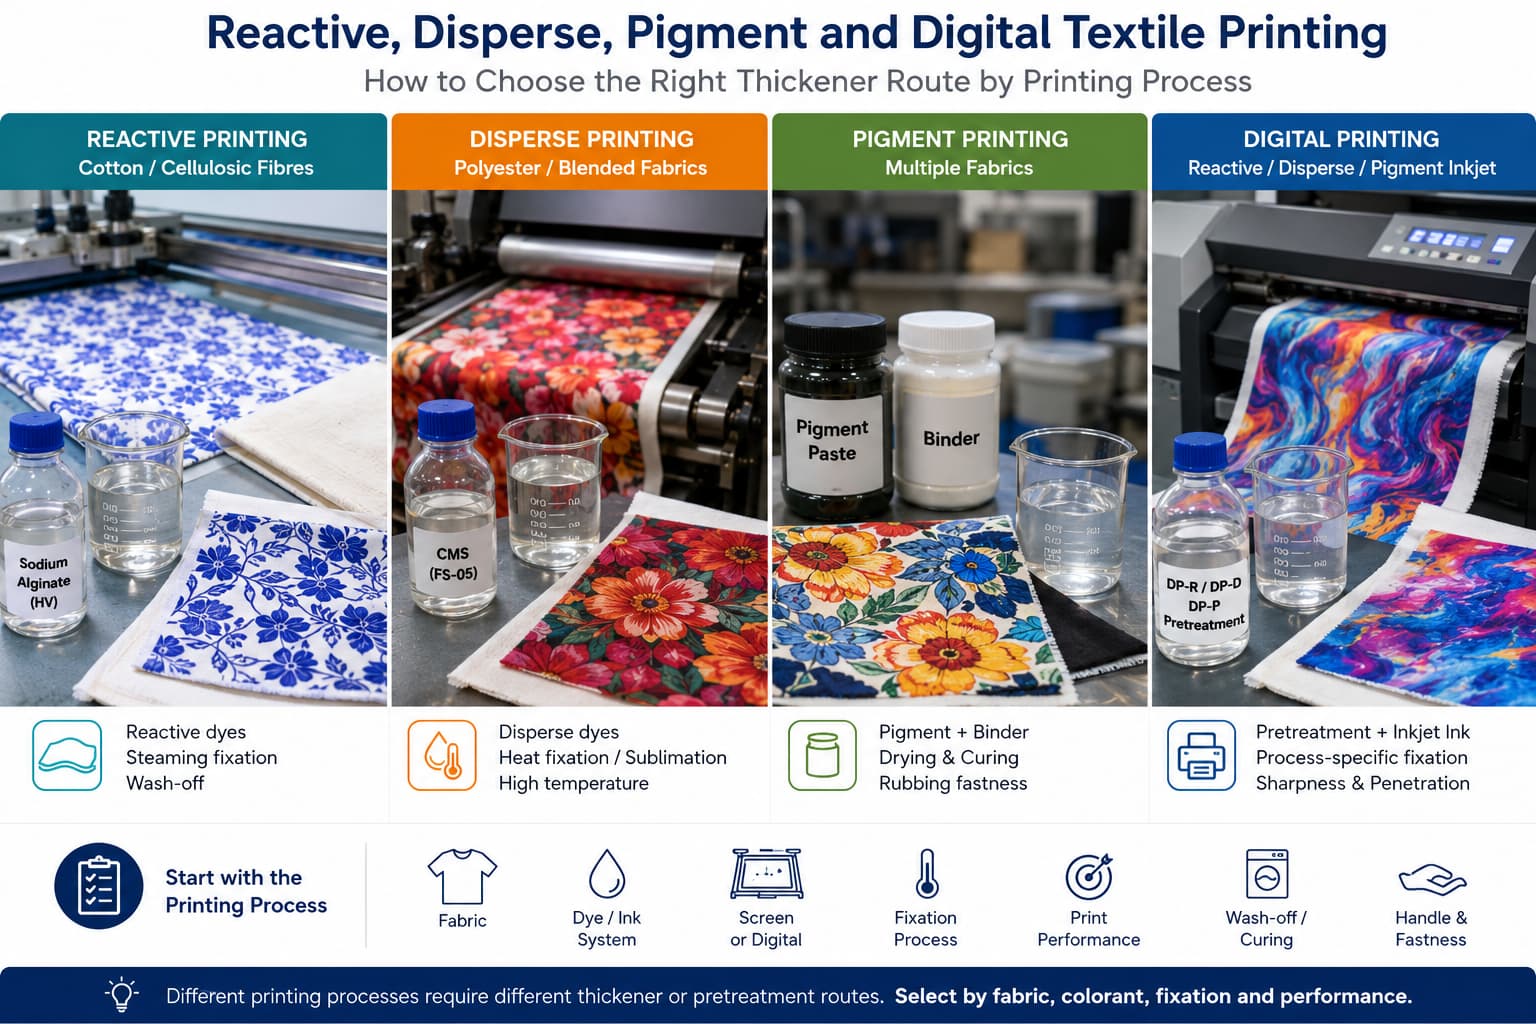
Tìm hiểu cách lựa chọn chất làm đặc và quy trình tiền xử lý cho các phương pháp in dệt phản ứng, in phân tán, in sắc tố và in kỹ thuật số, dựa trên các yêu cầu về vải, thuốc nhuộm hoặc mực in, quá trình cố định màu, khả năng rửa trôi và chất lượng in.
Hỗn hợp in dựa trên CMC được sử dụng rộng rãi trong in vải bằng bột màu, in phản ứng và in kỹ thuật số. Hướng dẫn này giải thích các thông số quan trọng, cách so sánh các nhà cung cấp và những yêu cầu cần đưa ra trước khi đặt hàng số lượng lớn.
Cả natri alginat và CMC đều được sử dụng làm chất làm đặc trong in vải, nhưng chúng phù hợp với các hệ thống thuốc nhuộm và điều kiện quy trình khác nhau. Hướng dẫn này giải thích những điểm khác biệt chính và thời điểm nên sử dụng từng loại.
Việc lựa chọn chất làm đặc phù hợp cho in ấn trên vải không chỉ phụ thuộc vào loại vải. Người mua nên lựa chọn chất làm đặc sao cho phù hợp với hệ thống thuốc nhuộm hoặc bột màu, phương pháp in, tính lưu biến mong muốn, yêu cầu về khả năng rửa trôi và các điều kiện thử nghiệm thực tế tại nhà máy.
Hiệu quả in trên vải phụ thuộc vào một hệ thống hóa học phối hợp nhịp nhàng, chứ không phải chỉ dựa vào một chất phụ gia duy nhất. Cẩm nang này giải thích về mười nhóm hóa chất quan trọng, chức năng của chúng, vị trí ứng dụng cũng như những điều người mua cần kiểm tra trước khi tiến hành thử nghiệm sản xuất.
Các chất làm đặc dùng trong in vải có sự khác biệt về thành phần hóa học, tính lưu biến, khả năng tương thích với thuốc nhuộm và đặc tính phai màu khi giặt. Hướng dẫn này so sánh các nhóm chất làm đặc chính, các hướng ứng dụng phổ biến của chúng và các thông số mà người mua cần kiểm tra trước khi tiến hành thử nghiệm sản xuất.
Việc lựa chọn chất nhão in kỹ thuật số cần dựa trên thành phần hóa học của mực, loại vải, phương pháp in và quy trình xử lý sau in. Hướng dẫn này so sánh các phương pháp tiền xử lý sử dụng alginat natri, CMC, CMS, polymer tổng hợp và hỗn hợp trong in phun trên vải.
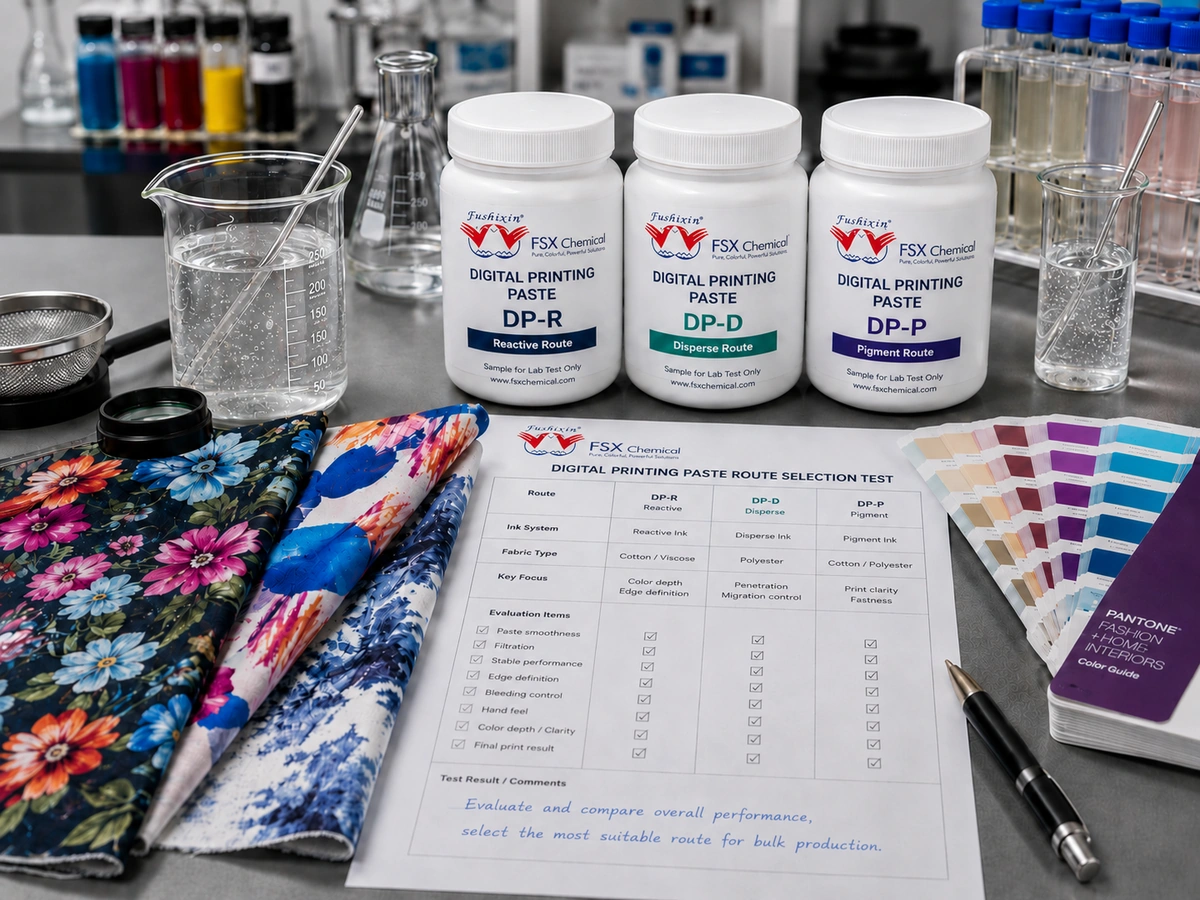
FSX Chemical cung cấp các quy trình sản xuất bột in kỹ thuật số riêng biệt dành cho các hệ thống mực phản ứng, mực phân tán và mực sắc tố, kèm theo dịch vụ đánh giá ứng dụng, đối chiếu mẫu và tài liệu kỹ thuật. Hướng dẫn này giải thích cách người mua có thể đánh giá quy trình phù hợp trước khi đặt hàng số lượng lớn.
Để có được hỗn hợp in kỹ thuật số ổn định, không chỉ cần đạt được độ nhớt mục tiêu. Hướng dẫn này giải thích cách thức mà việc lựa chọn sản phẩm, chất lượng nước, thứ tự pha trộn, quá trình trộn, độ pH, nhiệt độ, quá trình lọc, vệ sinh, bảo quản và hồ sơ chất lượng ảnh hưởng đến quá trình tiền xử lý và tính nhất quán trong sản xuất.
Bài đánh giá sản phẩm này phân tích sản phẩm FSX Digital Printing Paste với vai trò là giải pháp tiền xử lý và làm đặc mực in phun trên vải, tập trung vào các khía cạnh như sự tương thích với hệ thống mực, tính lưu biến, quá trình lọc, độ sắc nét của bản in, độ ổn định và các thử nghiệm trong điều kiện sản xuất thực tế.
In kỹ thuật số trên vải không chỉ đòi hỏi mực in và đầu in tiên tiến. Hãy khám phá các giải pháp hóa học chuyên biệt cho từng quy trình in phun mực phản ứng, mực phân tán và mực pigment, từ xử lý tiền in và tính lưu biến đến lọc, cố định và xác nhận quy trình sản xuất.
Hóa học in trên dệt may đang phát triển vượt ra ngoài những so sánh đơn thuần về độ nhớt và giá cả. Hãy cùng khám phá năm hướng đi đổi mới định hình xu hướng năm 2026, bao gồm các nguyên liệu hóa học an toàn hơn, chất làm đặc sinh học lai, chất kết dính sắc tố tiên tiến, quy trình in kỹ thuật số rút ngắn và các công thức đa chức năng.
Vui lòng cung cấp tên sản phẩm, ứng dụng, số lượng, điểm đến và bất kỳ tài liệu kỹ thuật (TDS),
hình ảnh mẫu hoặc tài liệu nào mà quý khách đã có. FSX Chemical sẽ xem xét
thông tin này và đề xuất bước tiếp theo liên quan đến báo giá, đối chiếu mẫu
hoặc lựa chọn sản phẩm.
Thông tin sản phẩmTên sản phẩm, cấp loại, mẫu mã, ảnh nhãn mác hoặc mã tham chiếu của nhà cung cấp.
Các tài liệu có sẵnTDS, SDS, COA, ảnh mẫu, danh mục sản phẩm hoặc dữ liệu thử nghiệm.
Chi tiết đơn hàngSố lượng dự kiến, hình thức đóng gói, nước nhập khẩu, cảng hoặc điều kiện thương mại.
Yêu cầu hoặc Vấn đềQuy trình in trên vải, yêu cầu về công thức, vấn đề hiện tại hoặc chỉ tiêu hiệu suất.